Rank the Risks Based on Criticality
Not all risks are equal. Ranking the ones you have identified is a key step towards building your prevention strategy.
Rank the Risks: the Criticality Matrix
Use this matrix to rank the risks, which will allow you to arrange them according to their probability and the severity of their potential impact. The result of these two factors will decide the criticality of the risk. The higher the level of criticality, the more attention you should pay.
As mentioned at the beginning of this course, for a risk to be a risk, it must be measurable.
Calculate the Probability (or Frequency)
If the weather forecast says there is an 80% chance of rain next Saturday, you will probably take your raincoat if you go out. This percentage is a measurement of the probability of you getting wet.
In risk management, measuring a probability means evaluating the likelihood of a risk becoming a problem.
For example, you can express this probability level on a scale from 1 (very unlikely) to 5 (highly likely). You base your estimate on your knowledge of the project and its context. You will notice how helpful project description methods can be when going through this process.
So if you plan to go out on a Saturday in July in Miami, the likelihood of rain is probably 1. But if you’re going out in Seattle in October, it’s probably a 5! 😉
You can also express probability through frequency. It doesn’t measure the likelihood of a risk becoming a problem, but the number of times this problem could appear.
Calculate the Severity
Let’s continue with the example of a weather forecast. Thinking that it’s going to rain is one thing, but you’ll probably also want to know whether you should expect a little rain or a downpour. If it’s just going to be a little rain, you might decide to travel to Miami or Seattle anyway. On the other hand, if it’s going to pour all weekend, you might decide to cancel your trip.
The context may also impact the severity of the risk: if you already have a cold, you may decide it’s not the best time to spend a weekend out in the rain.
Severity shows the potential impact of the risk on the project if it becomes a problem.
You can use the same scale as probability: from 1 (insignificant) to 5 (very significant damage).
Calculate the Criticality
Criticality represents the level of impact the risk could have on the project. It’s the result of the two previous measurements.
Suppose you use a scale of 1 to 5 for probability and severity. In that case, the possible values for the level of criticality will vary from 1 to 25.
You should deal with a critical risk (with a high level of criticality) at the start of your project, doing everything you can to reduce it. You’ll see how to do this in the last part of the course.
Create a Criticality Matrix
The criticality matrix, also known as a risk matrix, will do the work for you, allowing you to get a quick idea of the main risks you need to consider.
For each, estimate the probability (“What is the likelihood of this risk becoming a problem?”) and the severity (“What impact would this problem have on my project?”). Then place the risk in the matrix according to its level of criticality.
Position all of the risks you have identified on the same matrix.

Note that the increase of criticality (of the potential impact on the project) is exponential and not linear.
These criticality figures provide a more realistic vision of how a risk can disrupt your project if it becomes a problem.
Consider a criticality rating of greater than or equal to 10 as a high level that requires immediate preventive measures. If such risks become problems, then the impact on your project could be dramatic!
Identify Risk Areas
You must understand the differences between the risks positioned in the four different corners of the matrix, as you should handle them differently.
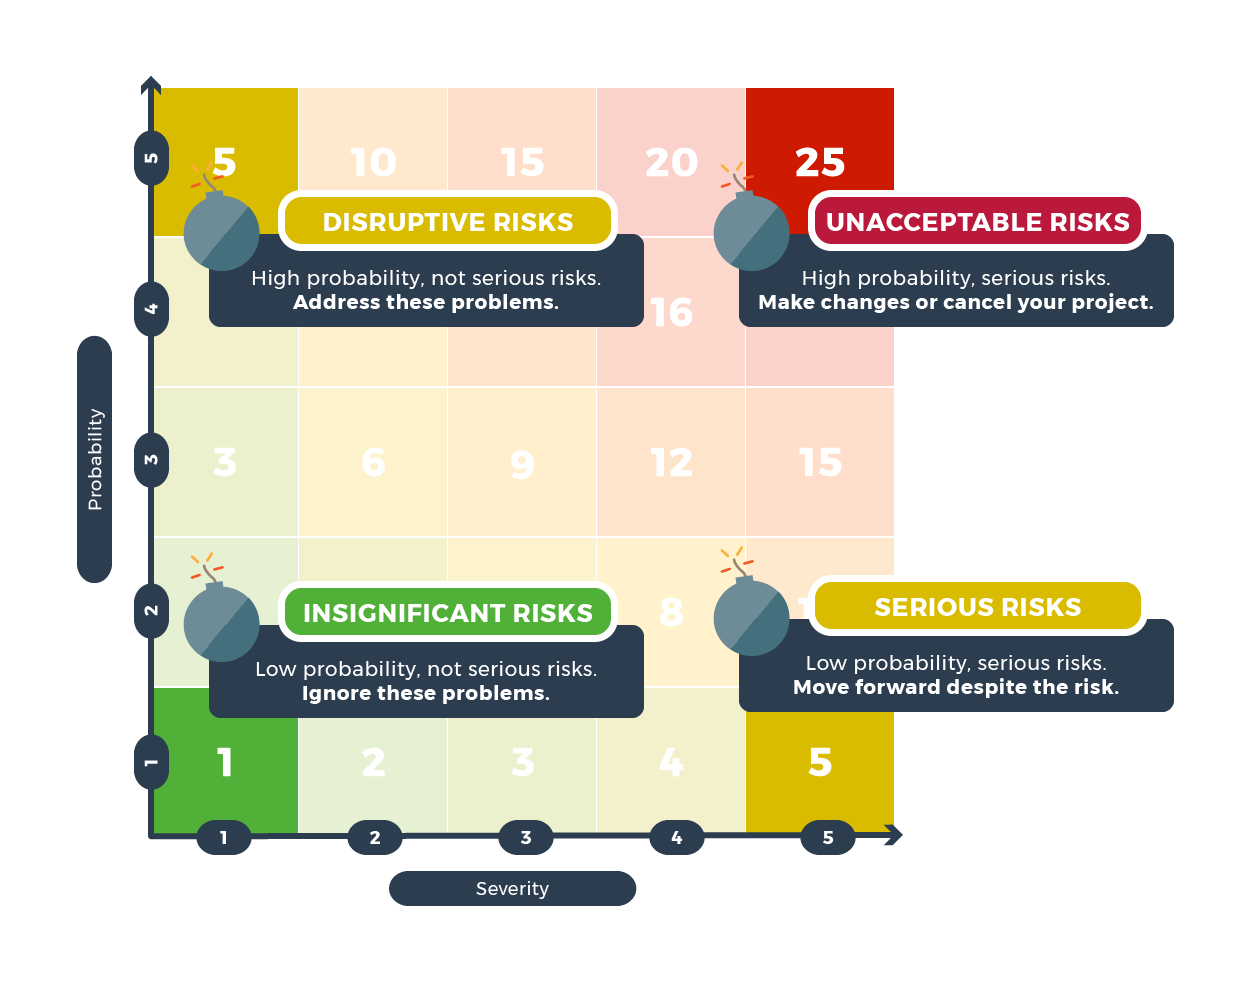
Identify Disruptive Risks
You should still solve a highly likely but not severe risk. If you don’t, it could disrupt your project regularly, even though the impact level is relatively low.
Such frequently occurring problems could significantly impact the project staff and your deadlines.
✅Identify the causes of these risks and solve them.
Identify Insignificant Risks
You will probably not lose sleep over an unlikely event with little impact on the project. So if you put a risk in the bottom-left corner of the criticality matrix, consider it insignificant.
✅ Don’t worry about insignificant risks.
Identify Serious Risks
A serious risk refers to an event that would be dramatic if it happened but is unlikely to occur. For example, a meteorite crashing into your office building and killing your entire project team could happen. Still, it’s unlikely, so you don’t have to worry about it.
You’ll have to live with these risks, especially since preventive measures may not always be effective against them.
✅ Don’t worry about serious risks.
Identify Unacceptable Risks
A highly likely and severe risk is a critical problem. “Unacceptable” means that the project cannot function with such a level of risk. You may have to cancel the project if you can’t think of an appropriate action to reduce the level of criticality.
Making changes to the project could help reduce such risks.
✅ Faced with unacceptable risks, you will have to modify or cancel your project.
Thinking about the categories and putting the risks on this matrix ranks them and lets you know which ones you need to deal with first. This is a good way of ranking the risks in digital projects.
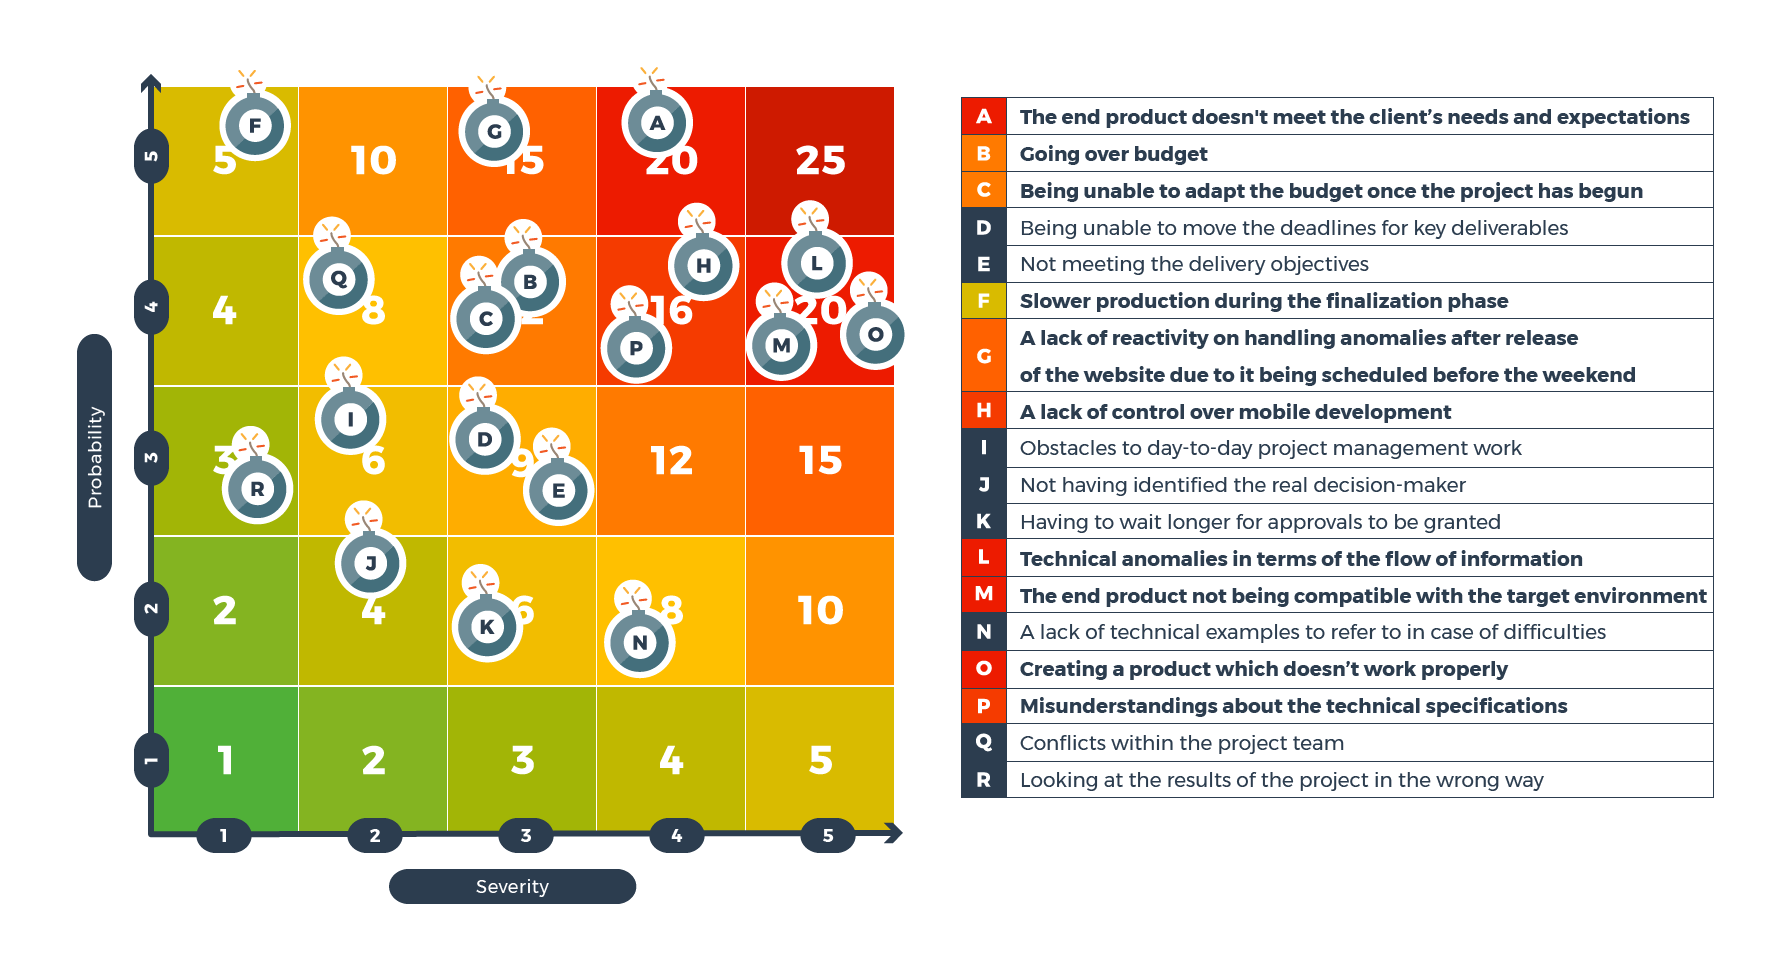
1 | The end product doesn’t meet the client’s needs and expectations. |
2 | Going over budget. |
3 | Being unable to adapt the budget once the project has begun. |
4 | Being unable to move the deadlines for key deliverables. |
5 | Not meeting delivery objectives. |
6 | Slower production during the finalization phase. |
7 | A lack of response to issues after the website release (scheduled for a Friday). |
8 | A lack of control over mobile development. |
9 | Obstacles to day-to-day project management work. |
10 | Not having identified the real decision-maker. |
11 | Having to wait longer for approvals. |
12 | Technical issues in the flow of information. |
13 | The end product not being compatible with the target environment. |
14 | A lack of technical examples to reference. |
15 | A product that doesn’t work properly. |
16 | Misunderstandings about the technical specifications. |
17 | Conflicts within the project team. |
18 | Looking at the results of the project in the wrong way. |
I measured the criticality level as 10 or above for around ten of these risks. To limit the potential harm, all risks over this number require action from the start.
Risk Detectability
The FMECA (failure mode, effects, and criticality analysis) method developed by the U.S. Army in the 1940s is also widely used in risk management and adopts a similar approach.
FMECA focuses on the criticality of a failure mode but has an extra element in the calculation.
Occurrence is the same as probability.
Severity represents the potential impact on the project.
Detectability allows you to consider the chance you won't detect the event, transforming the risk into a problem. The more detectable the event, the easier it should be to reduce its impact.
Imagine that you're going out for a bike ride at night. 🚲 You're careful and take your bike light with you, attaching it to the handlebars. One risk is that your light runs out of battery.
If it had a display showing the current battery levels, the likelihood of not detecting this would be lower, reducing criticality.

You often use an arbitrary scale to measure these three factors (i.e., 1-5 or 1-10).
Most of the time, project teams choose what level of criticality is acceptable for them. Then, they implement ways to reduce the level once they reach a threshold.
Risks below the threshold are considered acceptable and won’t require preventive actions.
Let’s Recap!
You can rank risks according to their level of criticality.
Criticality = probability x severity.
A criticality matrix will help you place the risks on an image for comparison.
Disruptive risks are problems you will need to solve.
Set an acceptable threshold for your risks. Once you reach them, implement preventive actions.
We have come to the end of the second part of this course. You now know how to identify risks in your project and rank them by the level of criticality. Check that you understand these concepts (I’m sure you have!) by taking the quiz.
Come back for the third and final part of this course, focusing on limiting these risks, building a prevention plan, and communicating about risk management.
