Visualize How Technologies Interact by Value Chain Mapping
In the previous chapter, we explored what we mean when we talk about emerging technologies. The next step is to examine the tools we will use to assess and evaluate these new developments.
This chapter will look at the difference between invention and innovation, then explore the value chain map approach.
The boundary between invention and innovation has blurred, especially in business speak. Innovation, in particular, has become a buzzword – an idea that many organizations claim to champion and value. But how do you distinguish between these two complementary ideas?
At the simplest level, an invention is the creation of something novel that did not exist before.
Invention tends to have an engineering or a scientific background. Lists of the world’s greatest inventions abound in print and online - but most all-time top tens will include things like the wheel, the printing press, the internal combustion engine, the telephone, penicillin - even the Internet!
Innovation, in contrast, takes things that are already available and combines them in a new way. The iPhone is a classic example of innovation rather than invention. There was little, if anything genuinely, technically novel about the first iPhones. All the components were available on other devices. What made it such a success was the way it was brought together.
The iPhone was an innovation that demonstrated novelty, coherence, and impact. It has changed the world by building on the inventions of the recent past.
Create a Value Chain Map
This idea of tech feeding off other tech is a central concept to grasp in your analysis of emerging technologies.
Perhaps the best way to capture that concept is to look at it visually. Value chain maps seek to do just that. Like any good map, these visualizations allow you to navigate uncertainty. In addition, they equip you with situational awareness:
They show you where something is and where to go.
They are context-specific, focusing on the problem at hand.
They illustrate the features of the landscape - or components (like hills or rivers) that will help or hinder your progress.
Value chain mapping provides a visual map that allows you to develop a plan for moving in response to emerging technology.
So how do you create a value chain map? To illustrate this, take a look at the work of Simon Wardley - a British researcher and former CEO who has lent his name to the Wardley map, which he created as a tool to inform business strategy.
Below you can see a simple example based on the idea of a tea shop that sells to the public.
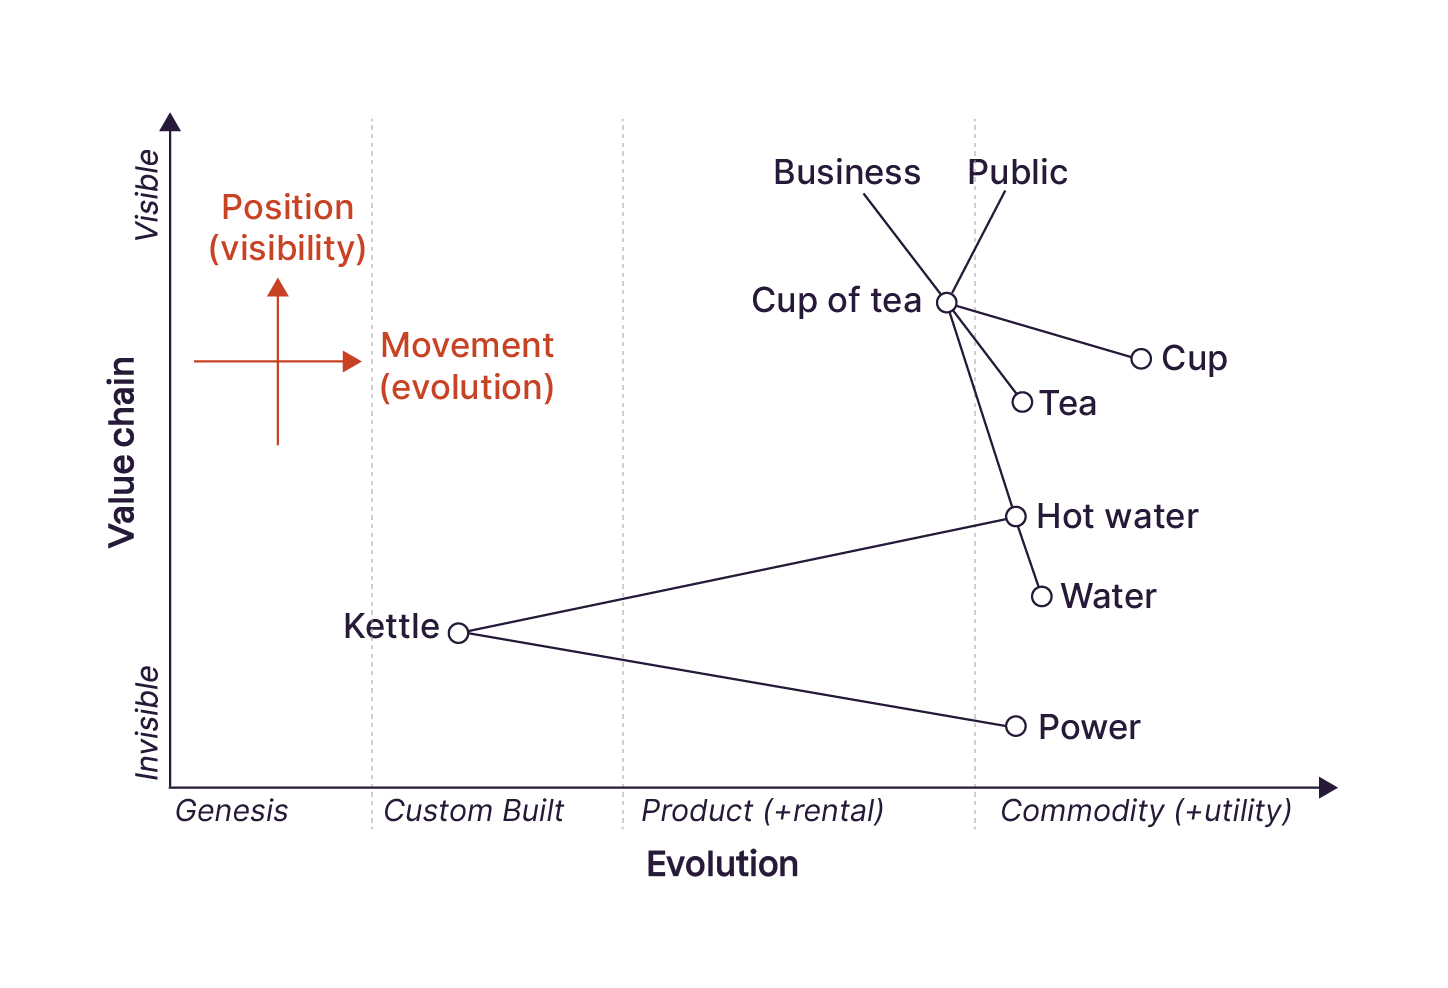
The map works in two directions - or two axes.
You plot your value chain components from the visible to the invisible elements (top to bottom). You see the customer’s needs first: buying a cup of tea. That is closely linked to the business’s needs: making money by selling cups of tea.
Working your way down to the invisible, we’ve mapped out what is required to produce the cup of tea to sell to the customer: the tea, the cup, the water that needs to be boiled and the power to heat that water.
Next, you will set out an axis of evolution (left to right). To understand an environment, you must understand context and change. In a Wardley map, you go from Genesis to Custom Built, to Product to Commodity, which are the evolutionary stages any emerging technology will pass through.
Understanding your value chain across these two axes will give you a map for that situational awareness to make the right decisions about how to set your strategy.
Here is a straightforward process for you to follow to create a Wardley map:
Observe
Identify the customer needs and then the business needs.
Draw out the components of the value chain necessary to satisfy those needs.
Plot those components against the visibility axis, from the visible needs (the cup, the tea) down to the invisible (the power required to run the kettle to boil the water to make the tea).
Orientate
Having created the first draft of the map above, make it available for others to critique, add to, and challenge your map so that you can adjust and improve it.
Decide
Now that you’ve created a way to understand the context in which you’re operating, it’s time to plan your response and strategy:
Where can value be enhanced?
How does our map compare to our competitors’ value chain?
What threats and opportunities can you see as components move along the evolution axis?
Act
The final step is to get going - start putting the strategy you’ve decided on into practice!
Of course, as you do this, you’ll want to constantly monitor the impact of your strategy to adjust and improve. You’ll also want to listen continuously to changes in the situation you’ve mapped.
Your Turn
You’ve seen how a Wardley map can shine a light on the process of making (and selling!) a cup of tea for customers. Now it’s your turn to map something relevant in your life.
Pick a subject to create your own value chain map. It could be either:
A simple map of a product or service your organization provides.
Something that you are a customer of that you can map back to see how your provider creates their value chain to meet your needs.
Go through the above steps using a blank Wardley map (download it here). Then create your own map.
Think about:
What are the visible and invisible components you need to place on the map?
How do they fit on the evolution axis? (Genesis → Custom Built → Product → Commodity)?
What threats and opportunities do you see for components to move along the evolution axis?
What strategies might you explore as a result of understanding the context?
Let’s Recap!
An invention is the creation of something that didn’t exist before.
Innovation takes things that already exist and combines them into new forms.
Value chain maps - such as Wardley maps - allow you to understand your operating environment. They are a vital part of understanding how to respond to - and push toward - innovation.
In this chapter, you learned how to create a value chain map and use it to understand your situation. In the next chapter, you’ll see how to go a step further and use value chain mapping to identify opportunities for innovation.
