Identify Opportunities for Your Value Chain Map
In the previous chapter, we looked at the difference between innovation and invention - and then created a value chain map to build situational awareness of the environment.
Now that you are beginning to understand that environment, in this chapter, we will examine how to use mapping to identify technology needs and opportunities to use emerging technologies to gain a competitive advantage.
How Do I Determine My Technology Needs?
Let’s return to the “Cup of Tea” Wardley map from the previous chapter.
We drew out the value chain map of the current situation to examine and challenge it. Now we can start to understand where we might make improvements to that value chain.
For example, we can quickly see that by applying technology - or changing our technology choices - we can make our business more effective and competitive. Or even leapfrog the rest of the industry.
Ask yourself:
Is there a technology that could replace something we are currently using?
How is technology currently being used? Could that be changed?
Will technology impose new constraints on our value chain?
Notice which component sits to the far left in the diagram. We are using a custom-built kettle. What is the cost versus benefit of this customization? We really need hot water, so what value does our brand-specific kettle bring? Does brand exclusivity add more value than we can save through moving to the use of standard kettles?
Let’s add those analyses - and some financial data - to our map so that we can model the effect:
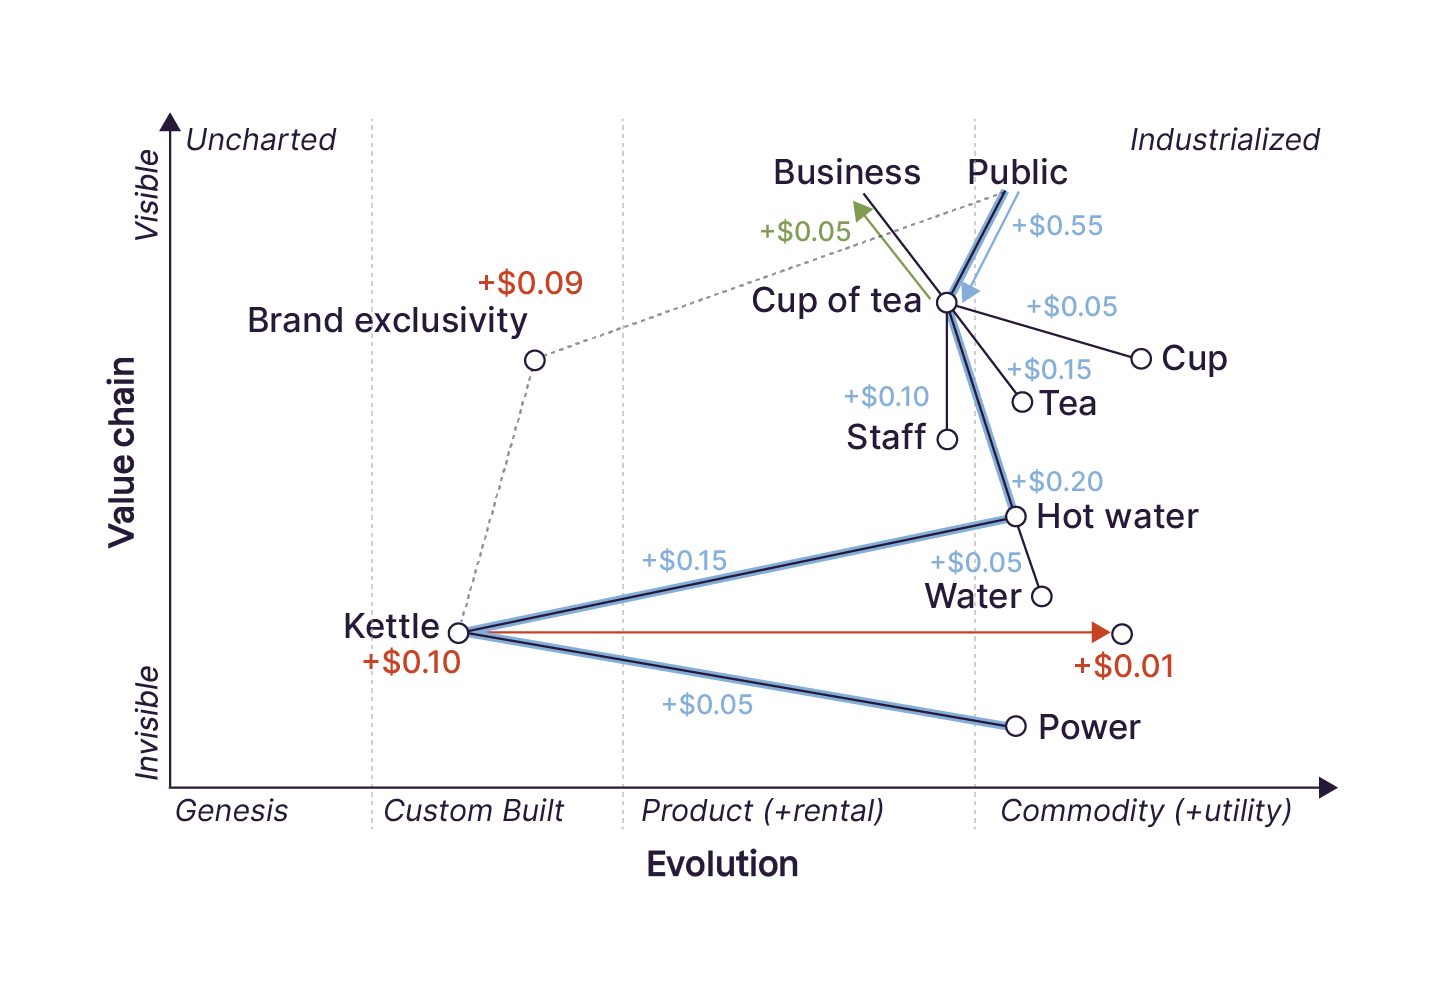
Here, you can see the economic implications of each step in the value chain we are mapping, particularly in reference to the kettle. For example, the cost of using the custom-built kettle equates to $0.10 per cup of tea. However, replacing it with a commodity kettle can reduce that cost to $0.01.
The value mapping shows a “brand exclusivity” cost of $0.09, the difference between those two costs.
We can go a step further and turn this into a basic income statement:
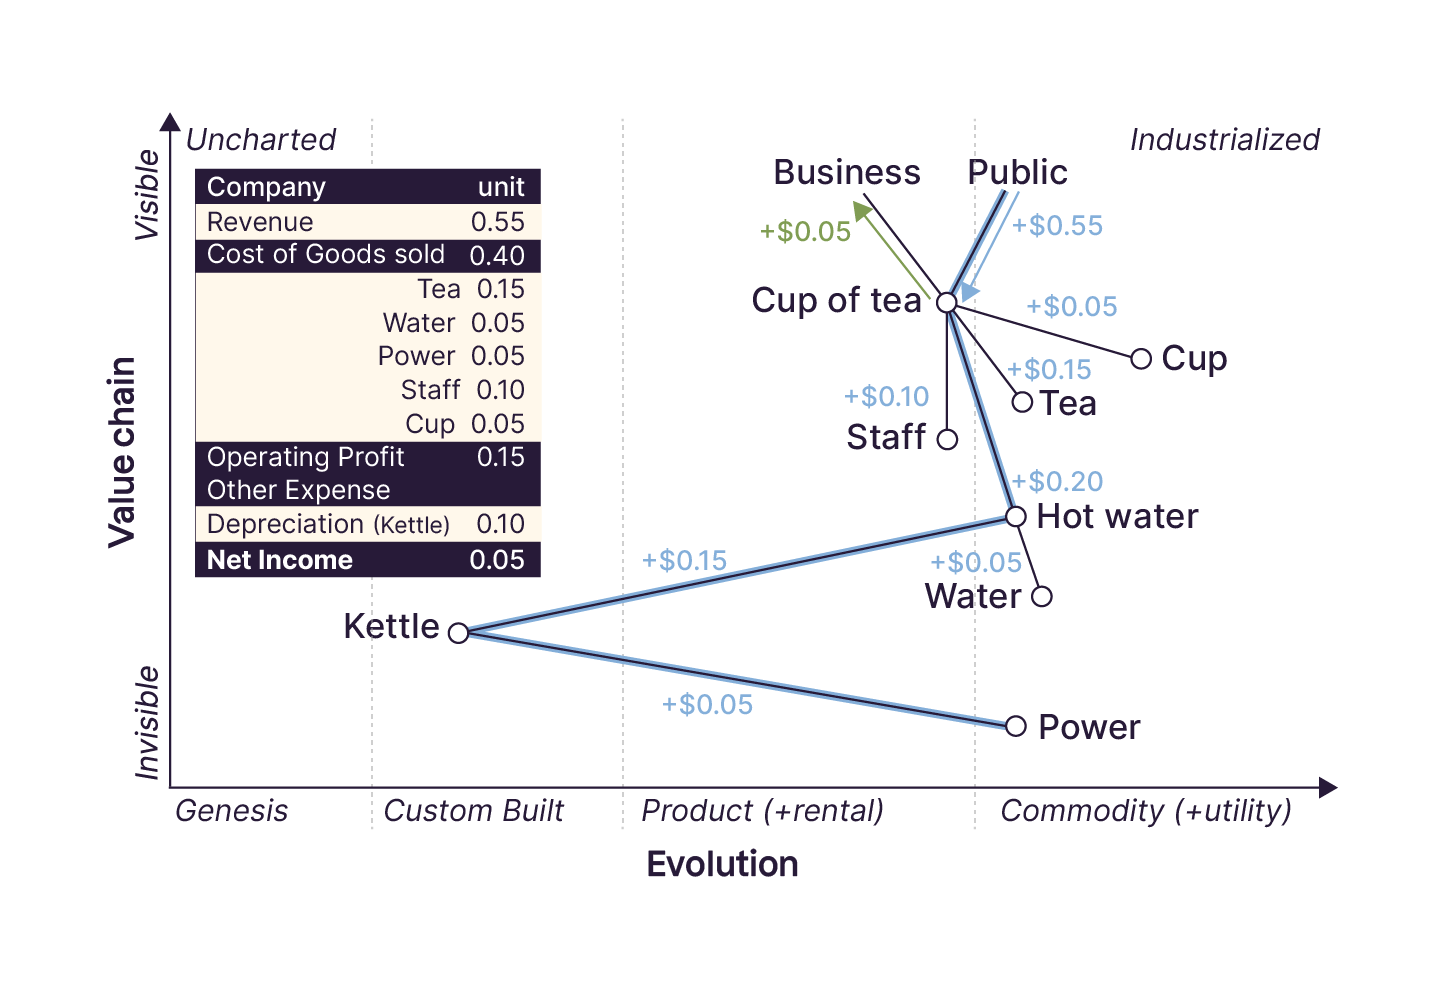
As the map has evolved, we’ve added the staff to our value chain map. Could robots replace them? What effect would this have on our business?
Looking at it like this, you quickly realize that economics and technology advancements are inextricably linked.
Get to Know the Theory of Fragmentation
If you take a longer-term view, you can see a pattern of emerging technology creating significant economic - and societal - change.
One early example of this was the invention of the printing press in 1455. This invention coincided with the commoditization of gunpowder, a well-established technology. Within just 30 years, this combination triggered a major fragmentation of a status quo that had existed for centuries. It can be linked to:
The undermining of the Catholic Church’s authority.
The Protestant Reformation.
The emergence of modern science.
The creation of entirely new occupations, professions, and industries.
A change in our perception of childhood, social order, and prosperity.
You can see this pattern repeatedly, the cycles of fragmentation gaining speed as the pace of technological advancement accelerate:
From the 16th century, the formation of guilds and licenses started regulating certain professions and trades. As well as controlling the quality of work, these licenses allowed a new way to raise revenue. This led to a major social fragmentation: the emergence of the middle classes.
By the 19th century, the Industrial Revolution again led to huge social and economic fragmentation and the introduction of management. Managers pass information from the shop floor to the board and deliver decisions from top to bottom.
The Industrial Revolution led to the creation of larger and larger organizations, quickly making the flow of information problematic: both difficult and too slow. So by the 20th century, fragmentation again led to increasingly hierarchical organizational structures. In addition, different departments (sales, product, marketing, finance, etc.) meant yet another layer of the social structure.
At each level of this cycle, new inventions are combined with existing technology to create a faster pace of innovation. Tech keeps building on itself. It moves through the evolution cycle from genesis through custom-built to product, and then to commodity. It sparks new ideas, inventions, and innovations - and it starts the cycle over again. And as it does so, it adds further economic and societal fragmentation cycles.
Let's take a moment to check in with Kary to hear more about the theory of fragmentation:
Your Turn
Now that you’ve seen the macro picture at work, let’s return to a ground-level view and apply these ideas to the value chain map you created in the previous chapter.
You may have decided to apply innovative technology to your existing value chain at the front end to understand better and meet your clients’ needs. Or perhaps you thought of using technology to solve efficiency problems at the back end, such as automating processes or the way information is handled.
If you haven’t already selected a technology for your value chain, or want to change your mind, you can make a new selection now.
Take time now to ask yourself:
Is the technology I selected mature enough to place in my value chain? Where would it sit on the evolution axis?
How would I implement that technology in my value chain?
Let’s Recap!
The Wardley map is a living, changing document. By examining it - and sharing it with others - you can find ways to change the map and improve your value chain.
Adding financial data to your map helps you to see and evaluate the impact and cost of adding new technologies.
The theory of fragmentation shows that technology feeds on itself: new tech combines with existing inventions and creates waves of economic and societal change.
In this chapter, you learned how to use value chain maps to identify technology needs and opportunities. You’ve also seen how technology creates a repeating cycle of change that leads to fragmentation.
Next up, we’re going to explore how to evaluate the technology readiness level of your technologies.
