Prioritize which experiments to run
Context
Consider the following scenario. You have an existing product with the following metrics:
1000 visitors/month to your website
60% of these visitors sign up for an account.
20% of users who create accounts return (log in again).
Of those users who login in more than once, 5% are paying users.
Of the 600 users that create accounts, around 2% refer the product to friends
How can you interpret these metrics? Should you be happy with this performance? How can you decide which metrics are the most important to improve? In this chapter, we will discuss two frameworks which you can use to determine which level of maturity your product has reached and what metrics represent success at each stage. The Pirate Metrics framework from Dave McClure and the Lean Analytics Stages framework from Alistair Kroll and Ben Yoskowitz will help us to determine where we are and what aspects of our current product's performance need to be improved.
This help us to "prioritize" which learning is the most important. This in turn helps us to determine which experiments we should conduct next.
Pirate Metrics
Dave McClure, founder of 500 startups, describes the stages of a startup as follows:
Acquisition - how do customers find us?
Activation - do they have a good enough first experience (to create an account)?
Retention - do they come back?
Revenue - how do we make money?
Referral - do customers recommend and send others?
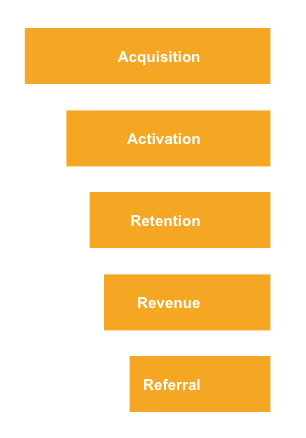
Dave suggests that we aim to define metrics in each of these stages and then focus on success in each stage before moving on to the next one.
For example, it is better to get a healthy retention rate (users coming back and therefore enjoying your product/service) before putting all your focus into monetizing and generating revenue. It is better to have customers that appreciate the value of your product (retention) before asking them to pay (revenue).
Examples of metrics
Acquisition: How many visitors to our website, physical store, app store, etc.
Activation: How many users are creating an account.
Retention: % of users who log in a second/third fourth time. How many of this weeks users return in the next 7 days.
Revenue: Average revenue per user, average revenue per category, lifetime value of users, average transaction amount. What % of users have cancelled their subscription this month (known as churn rate)
Referral: What % of your users recommend the product to friends?
There are some businesses where putting referral before revenue can be appropriate. Consider Dropbox's early growth, which was viral in nature. Each user got more storage space for recommending other users. Optimizing this (referral) would be done before optimizing the conversion of free users into paid (revenue).
Therefore, Dropbox may have chosen a sequence of Acquisition/Activation/Retention/Referral/Revenue.
This only applies to the last two steps (Revenue and Referral). Sometimes they are best interchanged when going viral is key to the adoption of the product.

Lean Analytics Stages
Alistair Kroll and Ben Yoskowitz, in their excellent book, Lean Analytics, describe a set of phases that each startup must go through. One excellent way to apply these stages is by requiring a business to focus and ask itself "which phase are we currently at?"
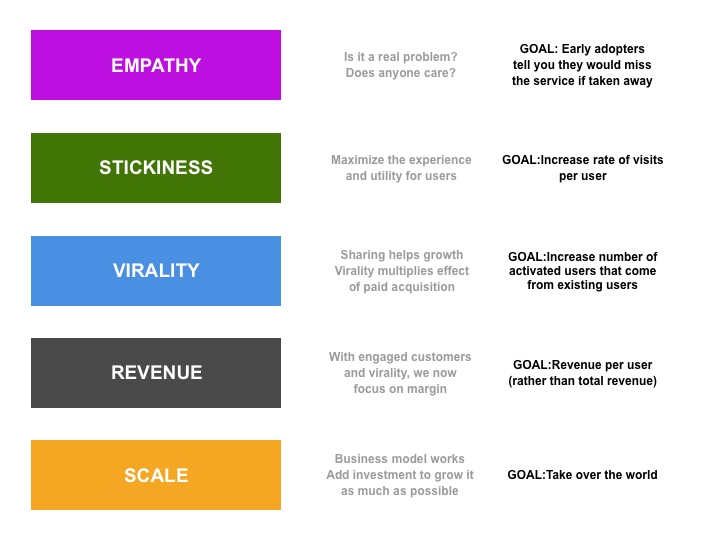
In this model, you have to reach a certain level of success in one phase before moving on to the next. If you have achieved success on the empathy phase (say 80% of early adopters tell you they would miss the service if removed), then your next target is to achieve success on the stickiness phase.
If you are aware of which Lean Analytics phase you are in, you can use the framework to suggest where to form hypotheses. You can then design experiments to validate those hypotheses using the Lean Startup approach.
One Metric That Matters
Kroll and Yoskowitz also talk about choosing the most important metric at any given moment in time and making sure that everyone in the organization is focused on improving this metric. They call this the One Metric That Matters (OMTM)
To find your OMTM, ask yourself:
what's the one thing that if it were measured and moving in the right direction would mean the business was doing well
what's the one thing that if it were measured and doing well would mean that other metrics would not matter
Validating Business Models
If you do not have an existing product and you are in a stage where you are validating your business model (e.g. you have sketched a one page business model canvas such as Ash Maurya's Lean Canvas), then you should ask yourself which is the "riskiest part of the plan" or the section of the Lean Canvas you feel the least certain about.
Ask yourself "how can I validate any assumptions that I have in this section?". This should lead to ideas of possible experiments. Your next experiments should be ones that seek to validate these assumptions within the shortest possible time frame.
You may find it helpful to state your hypothesis (i.e. assumptions) numerically . For example, 10% of users creating an account will log in again within 7 days. Once you have run an experiment that generates data which validates your assumptions, move on to the next riskiest part of the plan. Continue doing this until you have validated all the assumptions in the whole business model.
Summary
Pirate Metrics and Lean Analytics stages are both frameworks for helping you prioritize the most important factors to measure and improve given the stage of your product.
Choosing one of these frameworks will allow you to decide which experiments you should next run.
The Lean Analytics book (link below) can give you benchmarks for successful metrics given your product and industry
Additional Resources
Dave McClure's slideshare on Pirate Metrics
One of my favorite product books, Lean Analytics
The Lean Canvas
