Analyze Campaign Data

Gather Test Data
This activity serves as a reflection phase, where you bring together everything produced during the campaign you just completed. The goal is to reuse this information in future campaigns and reflect on your experience so you can improve next time.
Make sure you gather information from a variety of sources, such as:
the tests in the test plan,
exploratory tests,
test results,
defects created in Jira,
the features that were tested.
This gives you a complete overview of the campaign, allows you to reuse the data in future campaigns, and helps you analyze it to extract relevant insights about software quality.
Check the Data Before Analysis
Before analyzing test data, it’s essential to check the accuracy of what you’ve collected. You must ensure the data is both accurate and complete. If anything is missing or incorrect, update or correct it before going any further.
How can you tell if a piece of data is incomplete?
As a best practice, check the following:
The test plan is fully completed and clearly documents all executed tests.
All encountered defects are recorded in the defect-tracking tool and are understandable to every team member.
A report was produced for exploratory tests to track what was tested and the results obtained.
This verification step ensures everything is complete before moving on to the analysis.
Define the Goals of the Analysis
Analyzing test data helps identify trends, recurring issues, and areas that need improvement. To do this effectively, you must define the goals of the analysis.
What do we mean by “domain”?
A “domain” refers to the different aspects of the software or system that were tested—functionality, performance, security, compatibility, user interface, and more.
For example, you may want to identify areas needing improvement or determine the root causes of a recurring issue.
As a best practice, base your analysis goals on the objectives of the test campaign. It’s also important to identify Key Performance Indicators (KPIs) to measure the campaign’s results.
KPIs may include test coverage rate, defect detection rate, test duration, and more. It’s crucial to focus on data quality—ensuring accuracy and completeness—before beginning the analysis.
Here are a few examples of goals for analyzing test data:
Identify areas needing improvement.
Find the root causes of a recurring problem.
Evaluate the effectiveness of a new feature.
Optimize testing time.
Below are examples of KPIs that can be used in test data analysis:
Number of bugs per module or feature: identifies the most error-prone areas.
Defect resolution rate: measures how effectively test and development teams resolve detected issues.
Average time to detect and resolve defects: indicates the efficiency of testing and development, as well as overall code quality.
Regression rate: indicates how well the software maintains correct behavior after updates.
Automated test coverage rate: measures the scope and effectiveness of automated testing.
Application usage rate: reveals user adoption and which features are most used or ignored.
Application abandonment rate: highlights user frustration and potential usability or performance problems.
Analyze the Data
This step involves analyzing and interpreting the collected data.
Analyzing test results is a critical activity in the testing process because it helps determine the quality and stability of the software under test.
Here are some steps to follow:
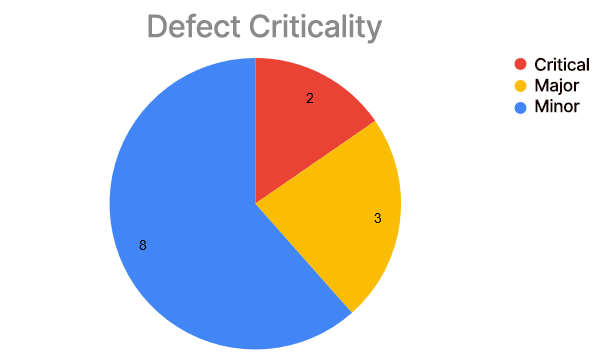
List critical and major defects and group them by criticality, for example in an Excel table.
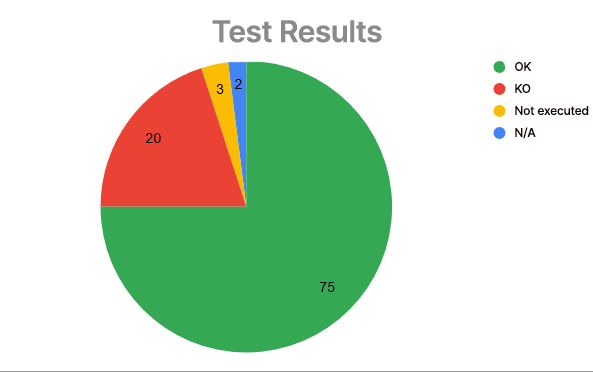
Count the number of passed and failed tests and record them in a second table.
Highlight failed features (features with at least one defect).
Compare results with the campaign’s objectives or, if needed, with the test strategy.
Use charts and tables: they present results visually and make them easy to understand. Tables can summarize results by feature, test step, or test type. Charts are useful for showing trends or discrepancies.
Once you have these indicators, you can visualize them using graphs, as shown below:
In short, analyzing test results means examining them in detail, understanding the root causes of detected defects, and making recommendations to improve the software’s quality and stability.
Over to You!

Now that you’ve completed your mini test campaign, it’s time to analyze the data.
Start by gathering the data. Here’s a checklist:
the tests in the test plan,
test results,
defects created in Jira,
features tested.
Use the Course material as support to verify the data and perform the analysis.
Summary
Gather your test campaign data.
Verify that the data is valid.
Define your analysis objectives.
Analyze the data.
Now that you’ve analyzed the results of the test campaign, you’re ready to write the final report.
