In the Sources tab, we find all the files loaded that make up the web page as we see it.

On the left, you'll find a list of folders and files that went into loading the page. In the middle, you can see the contents of the current file. It's even editable! On the right, you have a bunch of debugging tools and information.
Modifying source contents
In the last chapter, you saw that you can modify HTML elements or the style rules associated with them. However, in the Sources tab, you can modify whole documents at once.
For example, I can add an entire chunk of CSS in my styles.css file if I like.
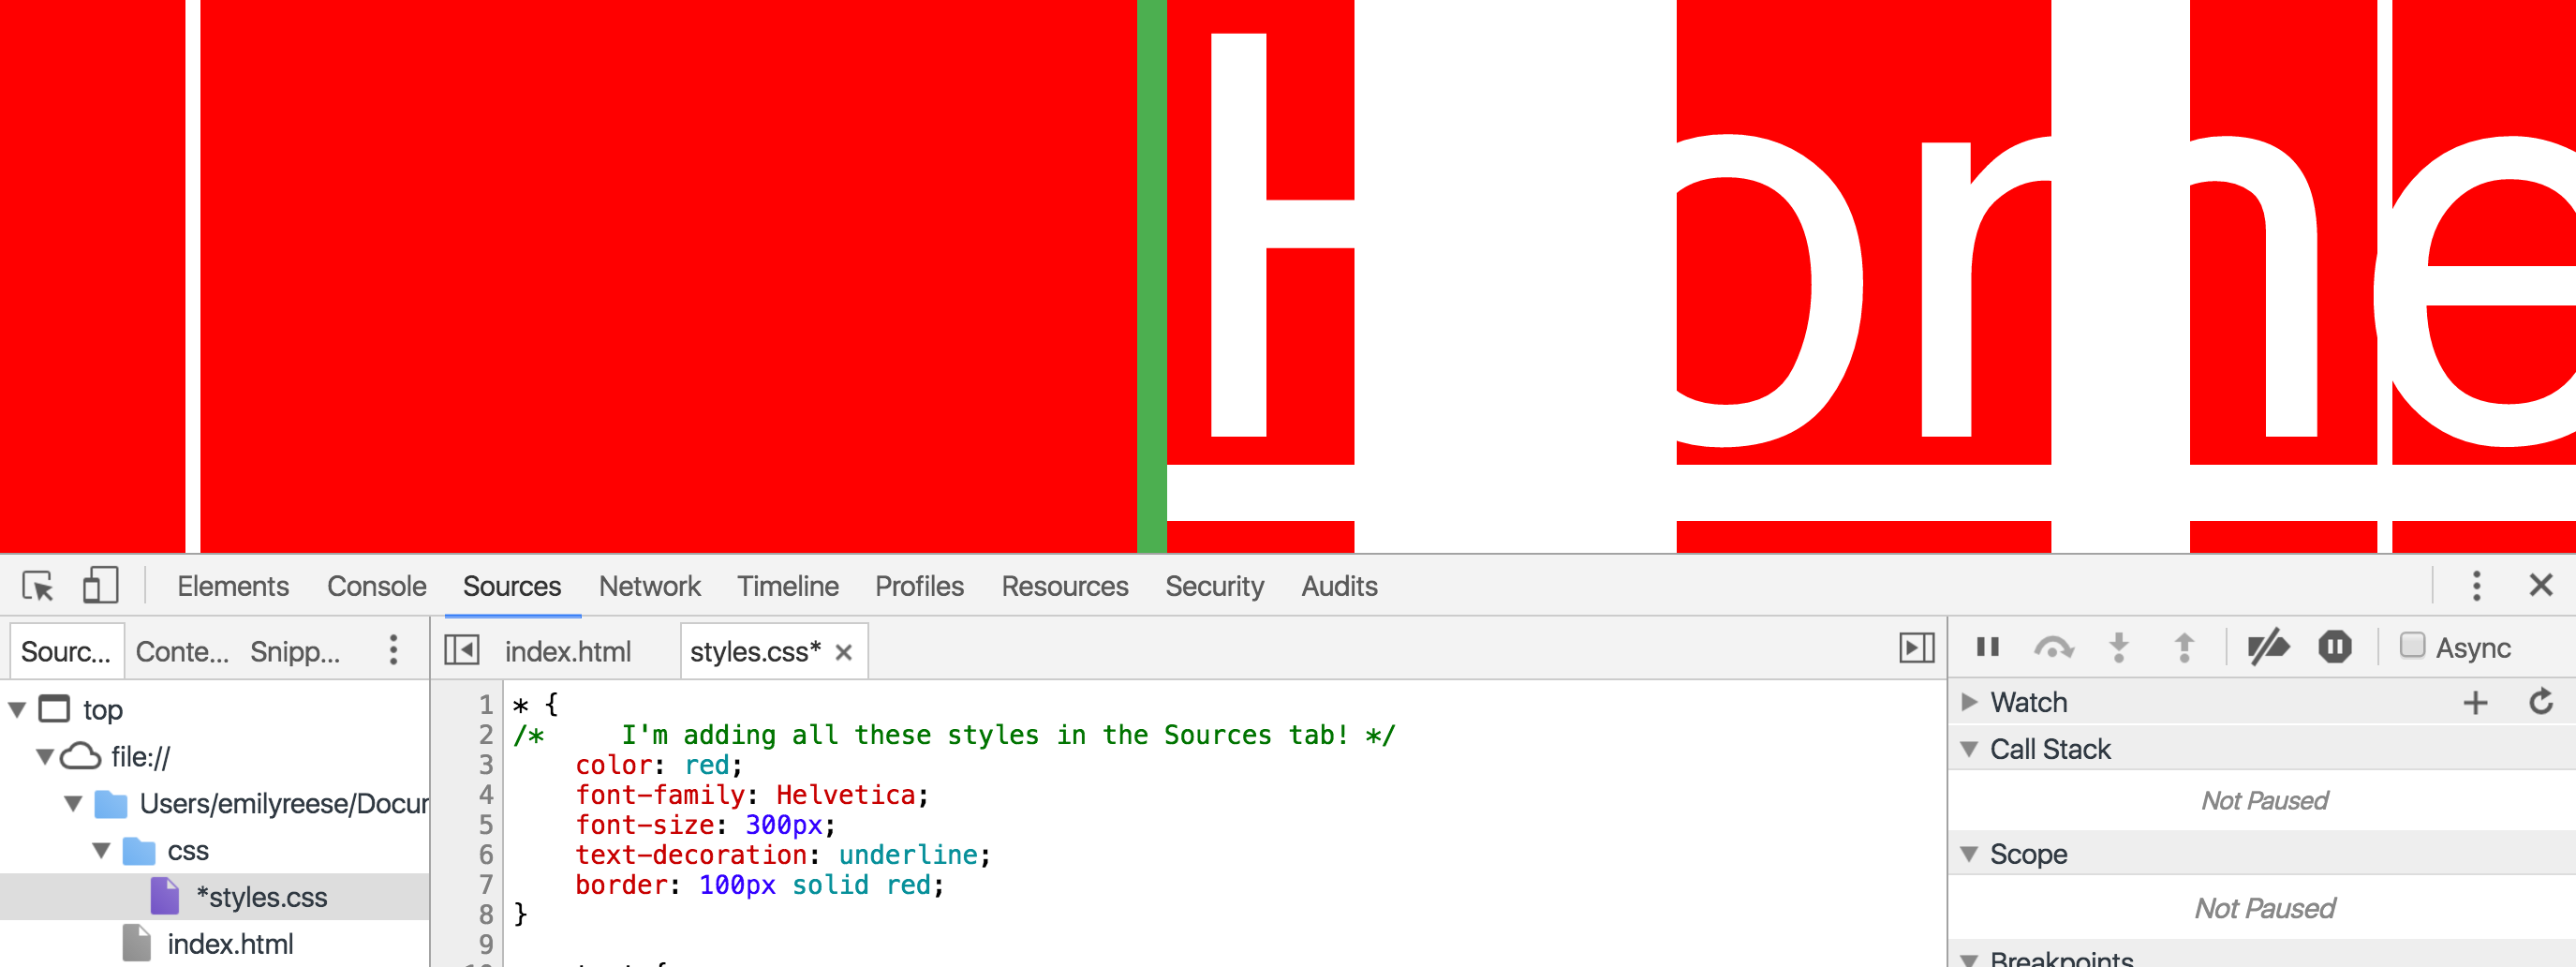
This obviously makes my page virtually unreadable, but you can see that I added these questionable style rules within styles.css directly via the Sources tab.
Add breakpoints
Breakpoints are a handy way to debug your code. Breakpoints are essentially a stop sign while your code is executing, saying "Stop here!" You can interact with your code, identify the value of variables at certain parts in time, and resume regular code execution when you choose.
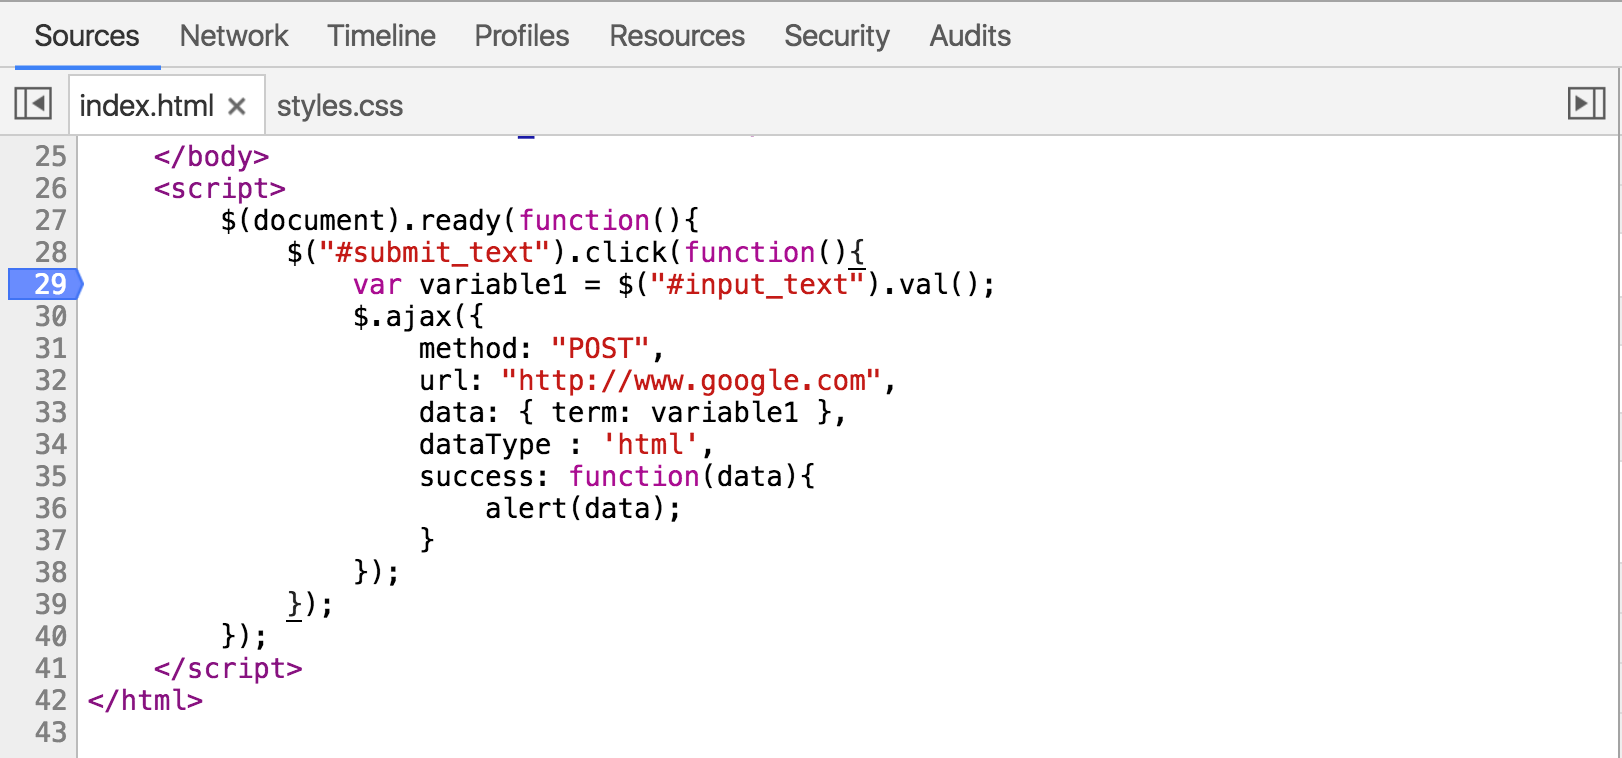
To set a breakpoint from within developer tools, click the line number where you want to stop your code from running. If I click line number 29 in the test page index.html document, a little blue arrow appears. This means I've set a breakpoint.
Once the breakpoint is set, you can refresh the page to run the code. It will pause automatically at your breakpoint. At this moment, you have 4 options, seen in the little menu below:

The play-ish button makes your code run again until the next breakpoint.
The rounded arrow lets you step over, or execute, your code line by line.
The down arrow represents "stepping into" the code. The debugger will move its execution to the first line in the function definition.
The up arrow represents "stepping out of" the code. This means the rest of the function will run, and the debugger will move to the parent function.
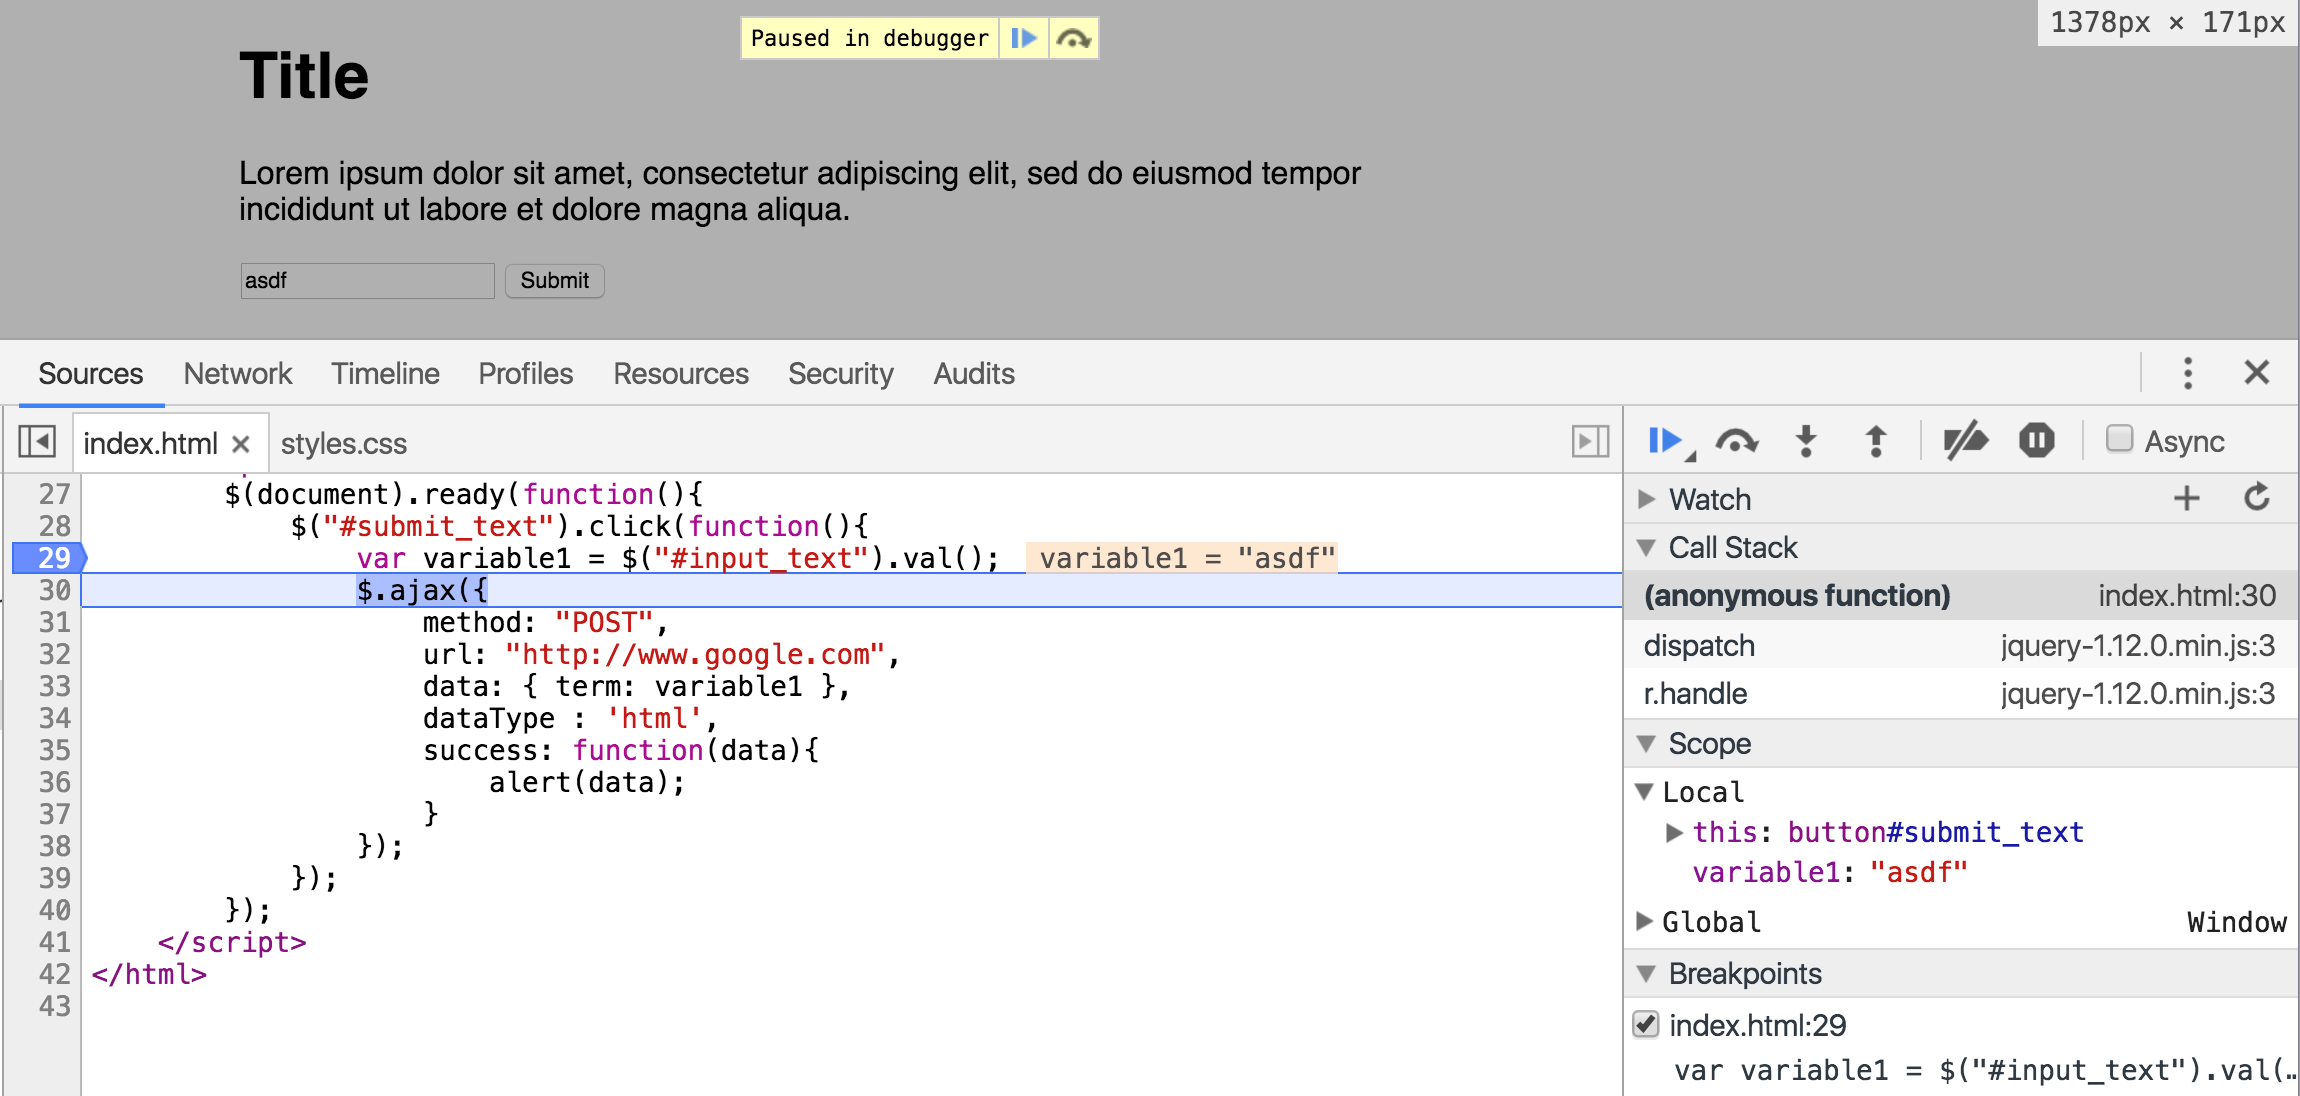
By adding a breakpoint in line 29 of the test page and refreshing the page, the code will stop executing upon hitting that line. Next, I can enter some content into the page's text box and click submit. From there, I can step through the code line by line (using the rounded arrow button above), and eventually I can see the contents of variable1 exactly as the code sees it at that moment in time!
I entered "asdf" in the page's text box, and it's exactly what I see highlighted in orange below!
As you can see, the Sources tab provides you with a great range of options for interacting with your source code!