Build a Model by Hand
Now, we are going to apply the approach you saw in the last chapter to a (slightly) more realistic example.
Look at this dataset, based on the latest World Happiness Report showing some features for 12 countries.
id | country | lifeexp | unemployment | happiness |
0 | Albania | 77.6 | 6.09 | Low |
1 | Bulgaria | 75 | 3.24 | Low |
2 | Iran | 75.8 | 2.11 | Low |
3 | Ukraine | 71.9 | 1.53 | Low |
4 | South Africa | 61.8 | 7.52 | Low |
5 | Ukraine | 71.9 | 1.53 | Low |
6 | Austria | 81.4 | 1.43 | High |
7 | Croatia | 77.3 | 5.53 | High |
8 | Denmark | 80.7 | 1.36 | High |
9 | Portugal | 80.8 | 4.37 | High |
10 | Uruguay | 77.1 | 0.16 | High |
11 | Thailand | 77.6 | 0.06 | High |
There are only 12 rows of data making it too small to do any useful machine learning, but it's perfect for understanding concepts.
If I asked you to use this sample set to come up with some rules that could predict whether a country has high or low happiness levels, based only on the other features (life expectancy and unemployment), how would you approach the problem?
In the next chapter, you will see how you can do this using Python machine learning, but first, let’s walk through a very structured approach manually.
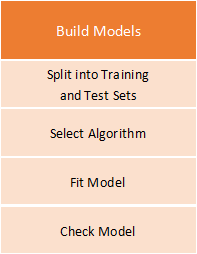
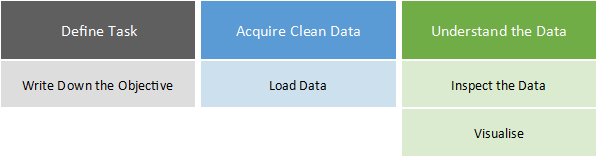
The following diagram shows the process to build supervised learning models.

Within each stage of the process, several activities could be done. The ones you choose depend on your overall objective, the data you have, your approach, and what you discover along the way.
Let’s take the happiness data above through this process.
Define the Task
Don't lose sight of what you are trying to achieve. Data investigations can take you down a variety of paths, and you may end up investigating something completely different! This is fine if your task is to find something interesting about the data, but not if it's to build a model that can predict if a customer is going to cancel a subscription. ^^
Write Down the Objective
In our sample project, the task is:
Use life expectancy and long-term unemployment rate to predict the perceived happiness (low or high) of inhabitants of a country.
Acquire Clean Data
Getting clean data to work with is a major challenge. Be prepared to put a lot of effort into this stage! Because this is your first introduction to supervised learning, I’ve prepared some clean data for you to load.
Load the Data
Let’s load the data. By that I mean to get it into a form you can easily investigate and manipulate.
Understand the Data
One important aspect of building machine learning models is to get a good understanding of the data. A machine learning model can’t perform magic. If you understand the data, you can then present it to the algorithms in a way that produces more effective results. We will look at a few ways to understand the data here.
Inspect the Data
Define the Features
First, look at the definitions of the features:
Here are the features in the dataset:
Feature | Description |
country | The name of the country. |
happiness | Whether the people of that country consider themselves to have high happiness (at least 5 out of 10) or low happiness (less than 5 out of 10). The happiness scores are calculated from survey responses that contain a number of questions. |
lifeexp | Life expectancy at birth in years. |
unemployment | The long-term unemployment rate, as a percentage of the total population. |
Make sure you understand what the data represents to avoid drawing poor conclusions from your investigations!
Look at the Data Shape
Let’s check the shape or size of the dataset.
There are 12 rows (sample points) and four columns (features).
The country is the unique index for the data. In other words, each row can be uniquely located based on the country.
The happiness column is categorical and has unique values: high and low.
The lifeexp and unemployment columns are numeric.
Apply Descriptive Statistics
Let’s compute some descriptive stats to get a numerical description of the numerical data. You can use your calculator or spreadsheet.
| lifeexp | unemployment |
mean | 75.7 | 2.9 |
Standard deviation | 5.4 | 2.9 |
min | 61.8 | 0.06 |
25th percentile | 74.2 | 1.41 |
median | 77.2 | 1.82 |
75th percentile | 78.4 | 4.66 |
max | 81.4 | 7.52 |
Visualize the Data
The above numbers help you understand the range and variance of the data, but some visualization would be useful at this stage. Let’s draw some box plots to better understand the range and variance.
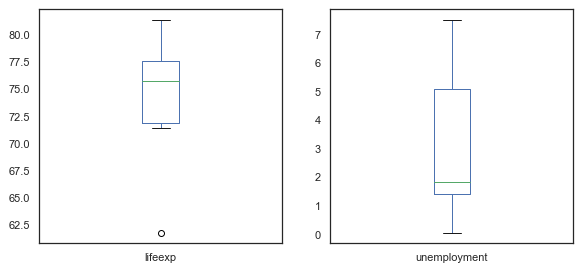
Here you can see that life expectancy is generally at the higher end of the range, and unemployment is at the lower end.
It will also help to plot a histogram, again to understand the variance:
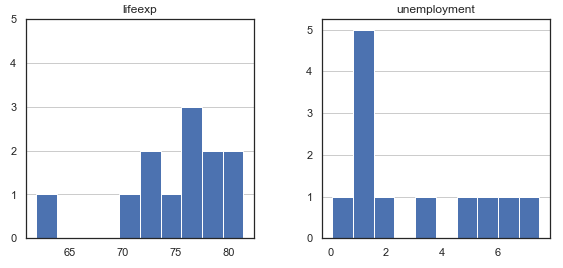
This further underlines what you saw in the box plots.
Let's now plot a histogram showing separate bars for each class (high and low). Countries with high happiness are shown in blue, countries with low happiness are shown in red.
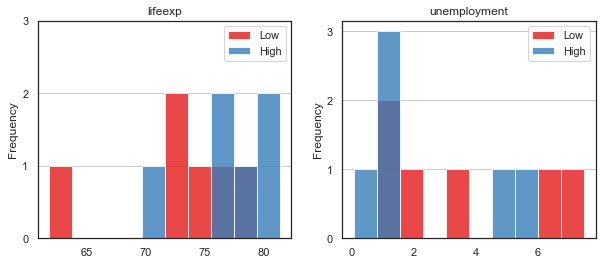
It's not clear-cut because the bars are not completely separated, but you should be able to extract some useful information to help in the classification task: Countries with high happiness tend to have a high life expectancy and low unemployment.
Prepare the Data for Machine Learning
At this point, organize the data to prepare for the machine learning task.
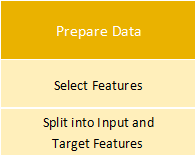
Select Features
First, discard anything you won’t use. While you could apply your world knowledge to the country feature for help predicting happiness (many know that Denmark is a happy place!), it’s not useful in the hard, statistics-based world of machine learning. You can’t use preconceptions to build a generalized model of the factors influencing happiness. So let’s remove country:
id | lifeexp | unemployment | happiness |
0 | 77.6 | 6.09 | Low |
1 | 75 | 3.24 | Low |
2 | 75.8 | 2.11 | Low |
3 | 71.9 | 1.53 | Low |
4 | 61.8 | 7.52 | Low |
5 | 71.9 | 1.53 | Low |
6 | 81.4 | 1.43 | High |
7 | 77.3 | 5.53 | High |
8 | 80.7 | 1.36 | High |
9 | 80.8 | 4.37 | High |
10 | 77.1 | 0.16 | High |
11 | 77.6 | 0.06 | High |
We will leave the id to keep track of the data.
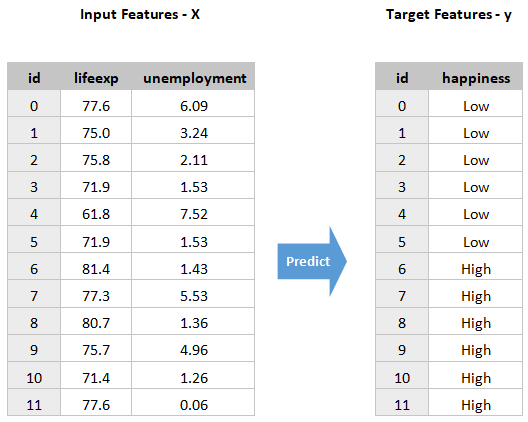
Split Into Input and Target Features
Next, let's split the data into input features (those we will use to make the prediction, which we will call ) and the target feature (the one we are trying to predict, which we will call ). Note that by convention, is capital, and is lowercase. It’s a convention - not a typo! Here is the data after the split:
Build the Model
The data is now in the desired form. Now for the exciting part - building the actual model!
Split Into Training and Test Sets
If you took the whole split and used it to train a model, how would you test it? It would be bad practice to use the same data used to train it! This would be like giving students an exam containing only questions they had answered before. Fortunately, data scientists follow good science processes and hold back some of the data for later testing. So we will split the data into a training and a testing set.
Typically, you would hold back ¼ or ⅓ of the data. Let’s go ahead and hold back ⅓ of the 12 rows, by randomly selecting four for the test set. There are now four piles of data as follows:
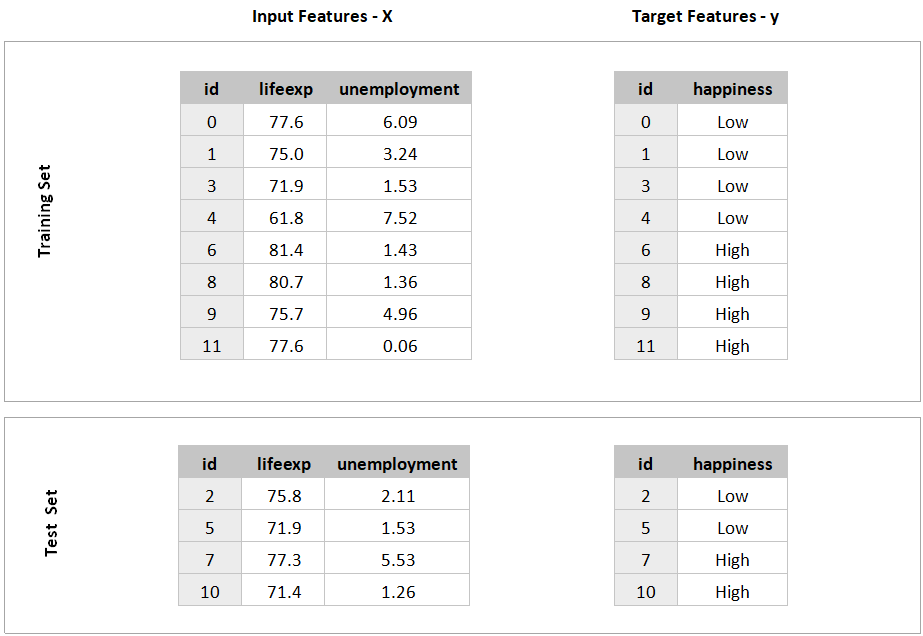
We will train a model using the training set and test the model using the test set.
Select the Algorithm
Remember, the task is:
Use life expectancy and long-term unemployment rate to predict the perceived happiness (low or high) of inhabitants of a country.
At this point, we can choose a machine learning algorithm and use it to build a model.
But to make things more interesting, I’d like you to be the model! In other words, I want you to make the rules. :soleil:
Fit the Model to the Data
In machine learning, when you build a model with data, you say you fit the model to the data. In other words, you ask the model to come up with some approach to represent the mapping of to in the training data.
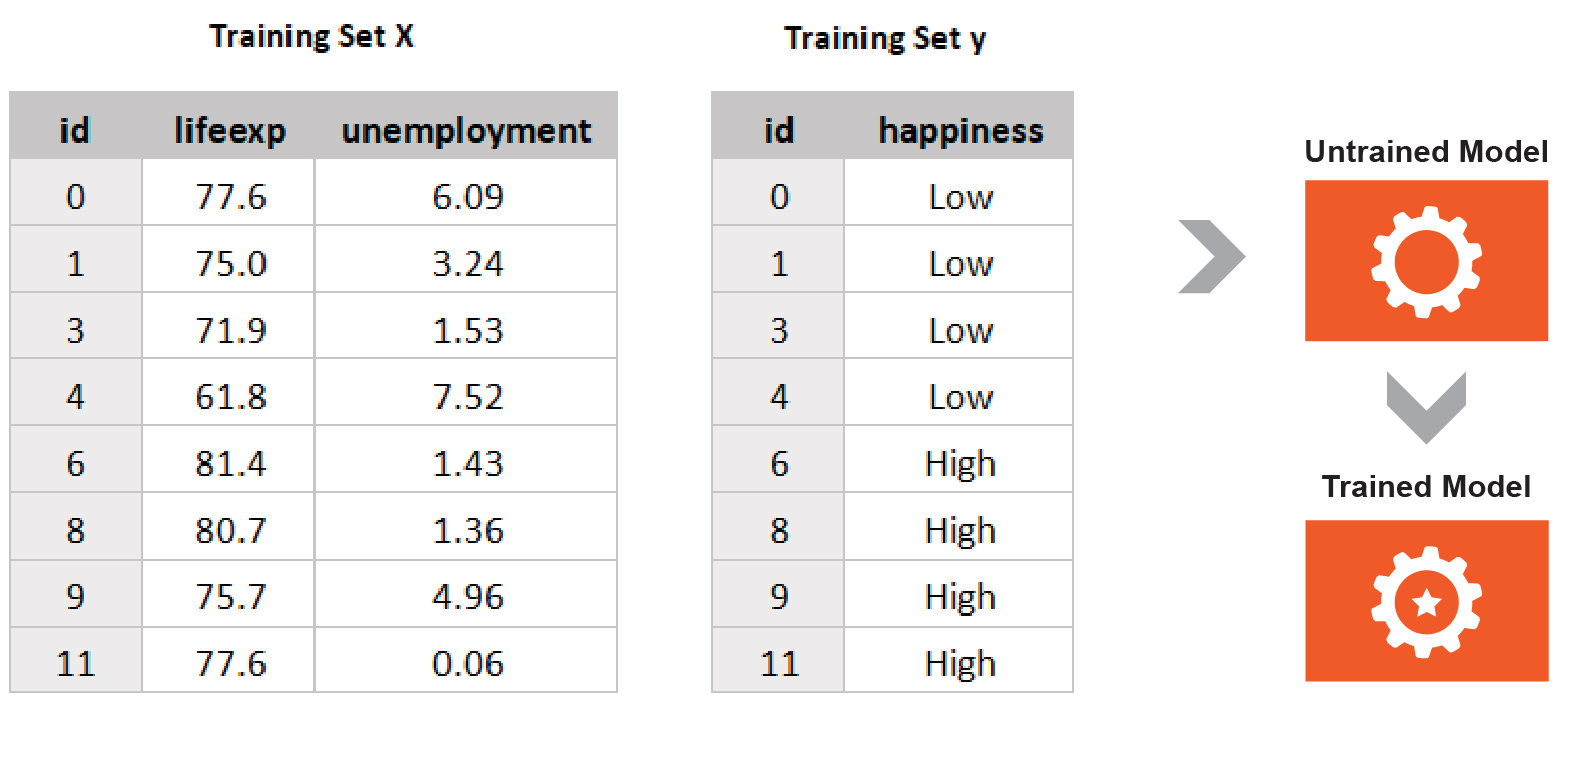
Your turn! As you are the model, take the training set only (cover up the test set so you can’t see it). Based just on this training set, can you come up with some rules, in the form of a decision tree, that can predict the feature in y based on the features in X?
To be clear, the rules you come up with should predict low happiness when presented with any of these rows:
id | lifeexp | unemployment |
0 | 77.6 | 6.09 |
1 | 75 | 3.24 |
3 | 71.9 | 1.53 |
4 | 61.8 | 7.52 |
And high happiness when presented with any of these rows:
id | lifeexp | unemployment |
6 | 81.4 | 1.43 |
8 | 80.7 | 1.36 |
9 | 80.8 | 4.37 |
11 | 77.6 | 0.06 |
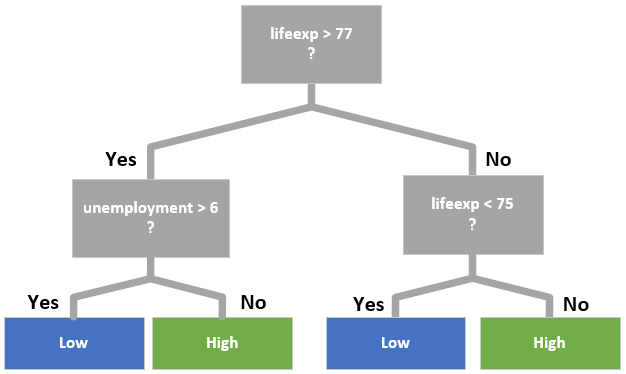
Check the Model
How did you do? Perhaps you have some rules now. They may look something like this:
Now assess how well you did in predicting the training data by running your rules against the training data itself. Write your predictions in a table like this:
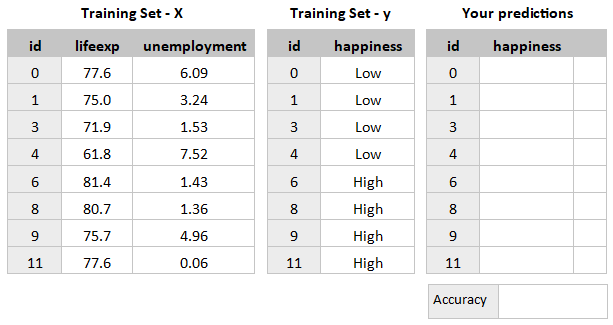
Then calculate your percentage accuracy score.
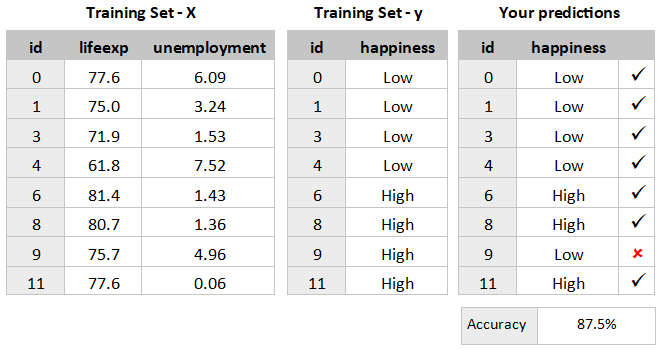
Here is how my rules performed:
Evaluate the Model
Now let's use the test set held back to evaluate how well the model performs on data that was not used in training. This should give you an idea of how the model will perform in the real world because this is data it has never seen before. We will make some predictions using the test sample and check the results against the test sample .
Compute the Accuracy Score
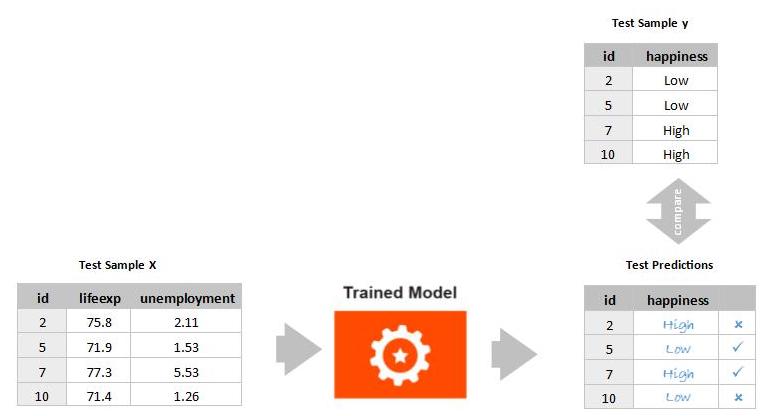
Using the same rules you created above, run them against the test data and write your predictions in a table.
Here are my results on the test set:
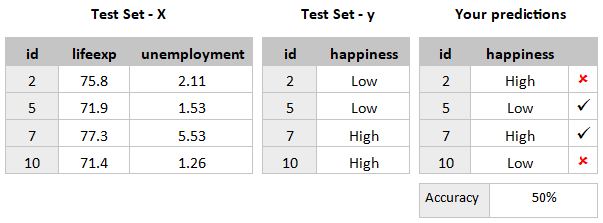
How did you perform? Hopefully better than me! 50% accuracy is pretty poor!
Recap
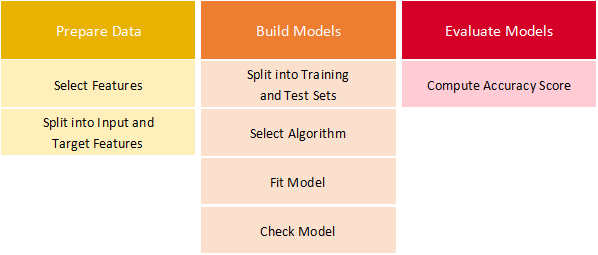
This is the overall process:
Within each step of the overall process, there were task-specific things we needed to do. For this particular one, this is what we did to define the task, acquire clean data, and understand the data:
And this is what we did to prepare the data, build the model, and evaluate it:
But wait! What about deployment?
In the next chapter, we are going to repeat the same process using Python!
