Visualize Qualitative Customer Data Along the Journey
In this chapter, we will take another look at quality of service as customers perceive it at different points along the journey. How the customer feels can be expressed in terms of expectations that they may have had about the product or the service compared to the degree to which they have been met by the organization.
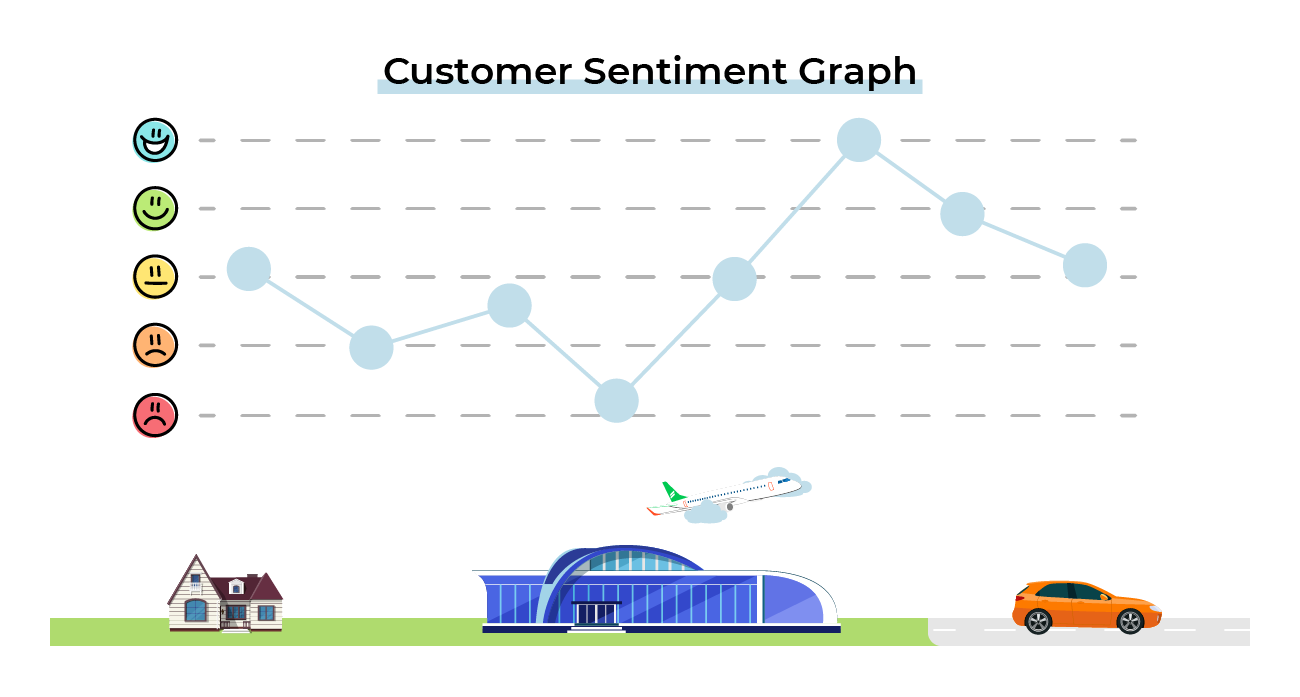
Collect Data to Create a Customer Sentiment Graph
The analysis of the feeling statements made by customers or users will give you a different way of visualizing the customer journey. This visualization will not be a description of the tasks performed at each step but a graphical representation of the customer’s feelings (or customer sentiment).
Notice that:
Satisfaction skews right - this means that the customer's sentiment improves as you move closer to the end of the customer journey.
However, this is not a simple progression from poor to excellent - there are a series of ups and downs.
Supplementing the customer journey map with an experience curve allows you to identify areas in which service needs to be improved quickly.
Using this insight, you can see which elements of the customer journey you can work on to improve the customer's experience - and, therefore, increase the likelihood of getting the customer to the advocacy stage (loyal customer) of the sales funnel as discussed in the previous chapter.
Your objectives could be to gain customer loyalty, get more information on customers (enrich CRM), get feedback for your website (e-reputation), etc. In all cases, any survey is an opportunity to get customers' perceptions in order to improve customer experience. In addition to demographic, behavioral, and business data, opinions can be integrated in your CRM to get a deeper understanding of your customer and better adapt your marketing strategy.
Measure Customer Satisfaction With the Experience, Not Memory
If you want to create an accurate customer sentiment graph, you need to be sure you measure customer satisfaction with experiences at every step of the journey. Daniel Kahneman, the recipient of the 2002 Nobel Prize in Economic Sciences, explains the difference between experiences and memory in this TED Talk.
Put simply, he says:
Experience is a psychological state forever in the present composed of three-second intervals, so 600,000 per month and 600 million in a lifetime.
Memory tells stories about past experiences and makes decisions based on these stories. Situational changes, important moments, and endings are central to the process of memorization.
End the Journey on a Positive Note
According to Kahneman's theory, when an experience ends on a positive note, it will color the customer’s recall of events and can erase unpleasant memories.
Use the Right Channel to Collect Feedback
Be careful to use the right channel to collect feedback according to your customers’ preferences and the context: SMS, mail, app, phone call, terminals, etc. If you do it right, you increase your chances of getting a high return rate on the survey.
Here are some situations illuminating the importance of choosing the right channel for collecting customer feedback:
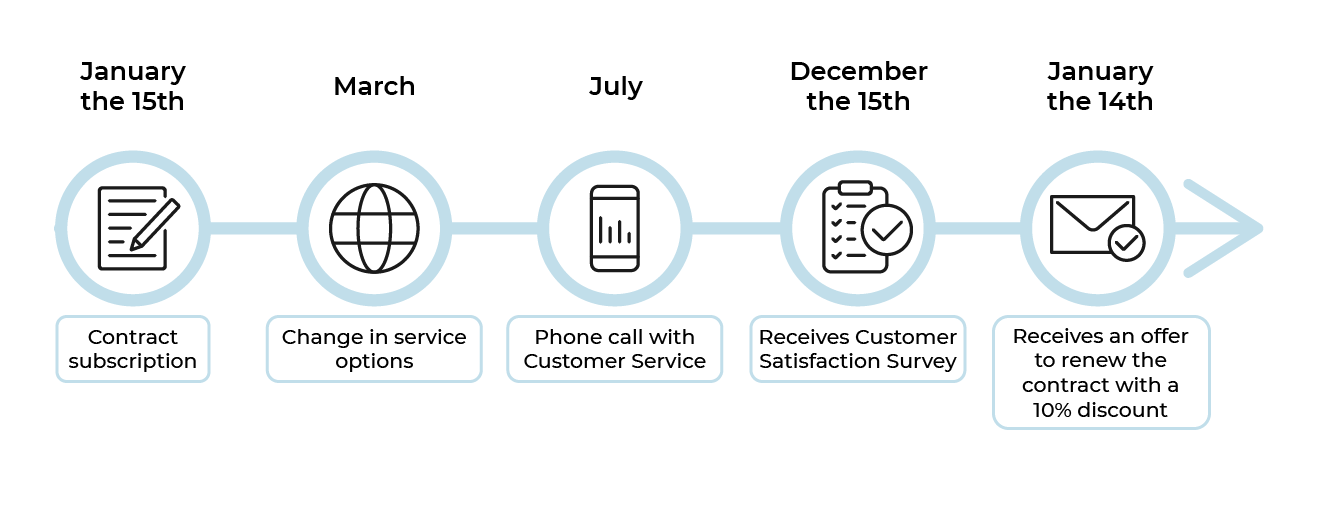
What: You are in charge of collecting customers’ feedback (households) to evaluate their one-year global experience (contract) with you.
How: You send them an email one month before the anniversary date of the contract. It’s a global experience with multiple interactions through different channels. Why start one month before? Because your objective is to boost the contract renewal rate.
Since the pandemic crisis, individuals have increasingly used QR codes, which was not the case before. QR codes can be the best way to collect customer opinions in some cases - if you are curious, read more.
Collect Instantaneous Feedback
This behavior change is also why, when compiling customer feedback, you should aim for instantaneous measurements. You can gather this feedback by a phone call less than two minutes after checkout. Conversely, deferred measurements, carried out several days after the customer’s visit to the store, are less reliable.
Instant measurements with a proper sample size are difficult to obtain but they provide an accurate picture of the customer's immediate experience at each stage of the journey.
On the other hand, deferred measurements (although easier to carry out) often leave too much room for cognitive memory bias. Avoid these in your customer sentiment graph.
Nevertheless, depending on your product or service(s), your customer sometimes needs to get a big picture of the whole experience before giving true feedback.
Let's Recap!
Supplementing the customer journey map with an experience curve allows you to identify areas in which service needs to be improved quickly.
Always ensure that the last step is rewarding so that it imprints a lasting positive feeling in the customer’s mind.
Aim to collect customer feedback at the right time, the right place, and with their preferred communication channels. You must avoid cognitive bias and a low rate of return.
Now that you know how, where, and when to collect customers’ feedback, it is time to identify your internal resources and constraints to integrate those insights into your marketing strategy. That is what we will see in the following chapter.
