Find Correlations in your Data
By now I’m sure you’ve realized that analyzing the relationships between variables is very important.
The concept of relationship between variables is known more formally as correlation. When we say that two variables are correlated, we mean that if we know the value of one, then it is possible to have a (more or less accurate) indication of the value of the other.
In the last chapter, when we asked: “Will knowing the value of an individual’s ‘age’ variable give us a better indication of that individual’s ‘level of interest’ in a given album?” we were already working with correlations.
Causality
As soon as we beginning talking about correlations, we open ourselves to the possibility of committing a very common error that should NEVER be made: that of assuming a cause-and-effect relationship between the two variables in question.
If there is a correlation between a variable A and a variable B , is A the cause of B , or B the cause of A? It is often impossible to know without conducting an experiment. Most often, the cause of A and B is actually a third (or fourth, or fifth...) factor C that isn’t even always observed.
It is also possible for two variables to be correlated without there being any relationship between them at all.
These are referred to as spurious correlations.

In fact, before we have the right to assume a cause-and-effect relationship between variables, we need to develop an experiment that meets specific conditions. And if your sample does not derive from this specially designed experiment, these conditions are generally not met.
If you like mathematical paradoxes, here is one that addresses cause and effect relationships: it’s called Simpson’s Paradox.
You’ll see: this paradox will blow your mind!
Thinking It Through...
As I do often in this course, I am now going to appeal to your imagination. It’s always good to use your imagination.
Today, you have a sudden desire to gather statistics concerning the people who live in your town. You want to know which of the following drinks they prefer: coffee, tea, water, or other.
So you investigate, going to cafés, quietly observing customers, and making a note of which drink they order. You collect data on a sample of 100 people. For each person, you record the drink they order and the name of the café in which you observe them. We will call these two variables café name and preferred drink. Here is the distribution you obtain for the variable preferred drink:
coffee : 50 people out of 100, or = 50 %
tea : 30 people out of 100, or = 30 %
other beverages : 20 people out of 100, or = 20 %
You continue your investigation, going to a café where you find 10 customers. How many people do you expect to see drinking tea? Intuitively, you expect to find 3 people drinking tea, because you know that, in general, 30% of people order tea. You have therefore made the following calculation: 30% x 10 = 3. Similarly, you expect to see 5 people drinking coffee, and 2 people with other drinks.
But to your great surprise, there are in fact 9 people drinking tea, and only 1 drinking coffee! This is very different from what you expected: 90% of people are drinking tea. Perhaps it’s just chance, you say, so you come back regularly to see if this 90% rate holds steady over time. And, it does: the percentage remains more or less the same after numerous observations!
However, it isn’t long before you understand why: the name of the café is “Chez Louise Tearoom.” This café is a bit out of the ordinary: it’s a tearoom! The customers who come here are primarily tea-lovers.
In a situation like this, we say that liking tea and frequenting the Chez Louise Tearoom are not independent of one another. If two events are not independent of one another, we expect to find a correlation between them. Do you recall the question we ask when we’re looking for correlations? Does knowing the value of one variable give us a more accurate indication of the value of another variable?
Will knowing that a person frequents the Chez Louise Tearoom give us a more accurate indication of his or her preferred drink?
The answer is yes! When we don’t know the value of the café name variable, we assume that the preferred drink variable will adhere to this distribution: 50% for coffee, 30% for tea, and 20% for other drinks. HOWEVER, when we know the value of the café name variable (here: Chez Louise Tearoom), we have a better indication of what the value of the preferred drink variable will be. In this case, we expect to find a lot more than 30% x 10 = 3 people drinking tea.
Let’s label the event “preferring tea” , and the event “being at the Chez Louise Tearoom” : Here is what we need to remember:
When you saw that was in fact equal to 9, you realized that “being at the Chez Louise Tearoom” was not independent of liking tea!
Learn About Contingency Tables
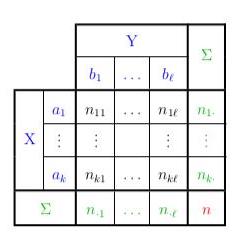
We can summarize all of this in something called a Contingency Table (where X = café name and Y = preferred drink):
| Coffee | Tea | Other | Total |
Chez Louise | 1 | 9 | 0 | 10 |
Well Ground Coffee | 9 | 6 | 5 | 20 |
Rendezvous Café | 20 | 10 | 10 | 40 |
Sarah's Kitchen | 20 | 5 | 5 | 30 |
TOTAL | 50 | 30 | 20 | 100 |

Let’s wrap up this chapter with a little terminology:
Each value of a contingency table (excluding the TOTAL columns) is called a joint occurrence
All of the joint occurrences taken together are referred to as the empirical joint distribution (café name, preferred drink).
The final row (TOTAL) is referred to as the empirical marginal distribution of preferred drink, and the final column (TOTAL) is referred to as the empirical marginal distribution of café name.
All of the joint occurrences in the first row (Chez Louise) are referred to as the empirical conditional distribution of preferred drink, given the value “Chez Louise” for the variable café name.
