Aggregate Data Using Pandas

Now that we can access everything we need within our DataFrame, let’s see how to aggregate the data, and what we actually mean by aggregating data.
Our bank operates in six different cities: Chicago, Detroit, San Francisco, Seattle, New York City and Baltimore. Each loan taken out by one of our customers is linked to one of these branches. So, you might ask yourself this question:
What if I want to calculate the monthly sales revenue figures for each branch? How would I do this?
Excellent question!
What we need to do is:
select all customers from the Chicago branch and calculate their total monthly repayments.
select all customers from the Detroit branch and calculate their total monthly repayments.
etc.
The final result will be one line per branch/city showing the total monthly repayment figure for each.
This operation would be called an aggregate in relational algebra. This is a very common DataFrame operation, used when you want to study the data from a particular perspective or recalculate certain variables, such as the average monthly repayment for each branch.
Let’s see how to do this using Pandas.
Aggregate Several Rows
The first method we can use to generate an aggregate in Pandas is.group_by.
To use this method, you need to focus on one or more columns, which will become the labels in your aggregate result.
Hmm... this reminds me of something...
That’s right! As we discovered in the previous chapter, the label index isn’t necessarily the integer position. It can also be a character string. In our example, our label will be the city variable. The label enables us to create a number of groups—one for each unique label value.
After choosing the columns you want to focus on, you’ll need to choose an aggregate function. The aggregate function will receive an input of a group of several rows, perform a calculation on them and return a unique value for each of these groups. The aggregate function we’ll use here is “sum.”
Let’s look at the following test DataFrame:
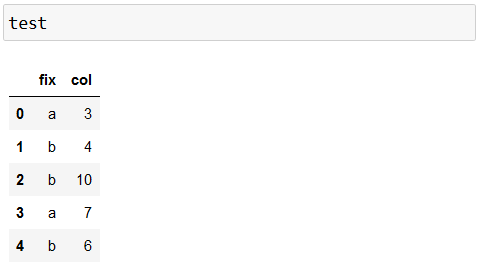
We want to calculate the mean average of the col variable for each value of the fix variable. The Python code to do this is:
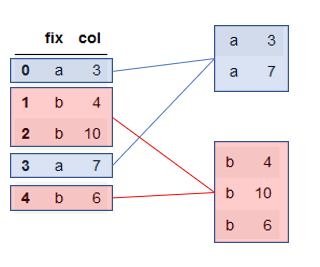
test.groupby('fix').mean()Let’s break down what happens when we run this line of code. Firstly, our label index will be the fix variable. So, we’ll create two groups: one for each value in our fix variable.
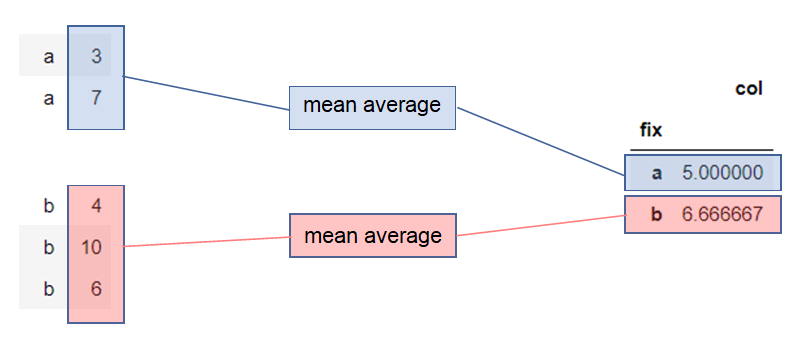
We’ll now apply our chosen aggregate function (in this case, mean average) to each of these groups to give us the desired result:
So, going back to our original question, how would we calculate the total revenue amount for each of our branches?
loans.groupby('city').sum()Now, let’s imagine that we want this same information by branch and type of loan. As you can probably imagine, we just need to send the list of variables to be indexed:
loans.groupby(['city', 'type']).sum()And if you just wanted the result to show the repayment variable:
loans.groupby(['city', 'type'])['repayment'].sum()We can even apply different aggregate functions to different columns, or apply several aggregate functions to the same column. Here, I’m calculating the sum of repayments by branch, as well as the maximum income :
loans.groupby('city').agg({'repayment': ['sum', 'mean'],
'income': 'max'})Let’s look at the last line of code shown above. Now, let’s imagine that we want to generate the same result but as a two-way table. We’ll see how to do this in detail in the next section.
Aggregate Rows and Columns
So, we want the same type of aggregate operation, but this time with our rows as bank branches and our columns as different loan types.
The method we use to do this is the.pivot_table. There are four arguments for this method:
index: variable(s) used as rows
columns: variable(s) used as columns
values: the variable to which we’ll apply our aggregate function
aggfunc: the aggregate function
The method to perform the opposite function is known asmelt. Go ahead and check out these two new methods in our video:
Right, are you ready to put all this into practice? Let’s go!
Over to You!

Background
You might have noticed that some customers have taken out a number of loans from our bank. This might skew the calculations we’ve done up to now. The loan manager comes back to you with some more specific requirements.
Guidelines
Here’s the email they sent:
Hi,
I have a few requests that I’d like you to look at as soon as you can. We need them for the executive committee meeting planned for the end of the week. Could you please:
create a customer profile DataFrame, showing all information about a customer summarized into one row.
calculate the exact number of people who represent a banking risk based on the level of debt and the customer profile.
calculate the total profit earned at each branch by loan type.
calculate the average profit for each branch by each loan type in the form of a two-way table.
let me know which city has the most potential for growth in real estate loans.
Thanks in advance!
Now go ahead and do the exercise.
Check Your Work
Well done for getting to the end! Here’s the solution.
Let’s Recap
If you want to aggregate data, you need to define one or more variable(s) as your index so that you can create groups and apply an aggregate function to them.
The final aggregate result will contain as many rows as there are different values of the variable(s) selected for the index.
There are two Python methods that can be used to produce an aggregate:
The
group_bymethodThe
pivot_tablemethod
Now we’re going to see how to merge several data files using Pandas.
