Create New Information From Existing Data
Use DAX Formulas
We’ve corrected the anomalies in the tables that Jane gave us, and we’ve connected the tables together. We’re now ready to calculate the borrower score.
To do this, we’ll use the flowchart Jane gave, which lists the different steps in considering whether to approve or reject a mortgage application:
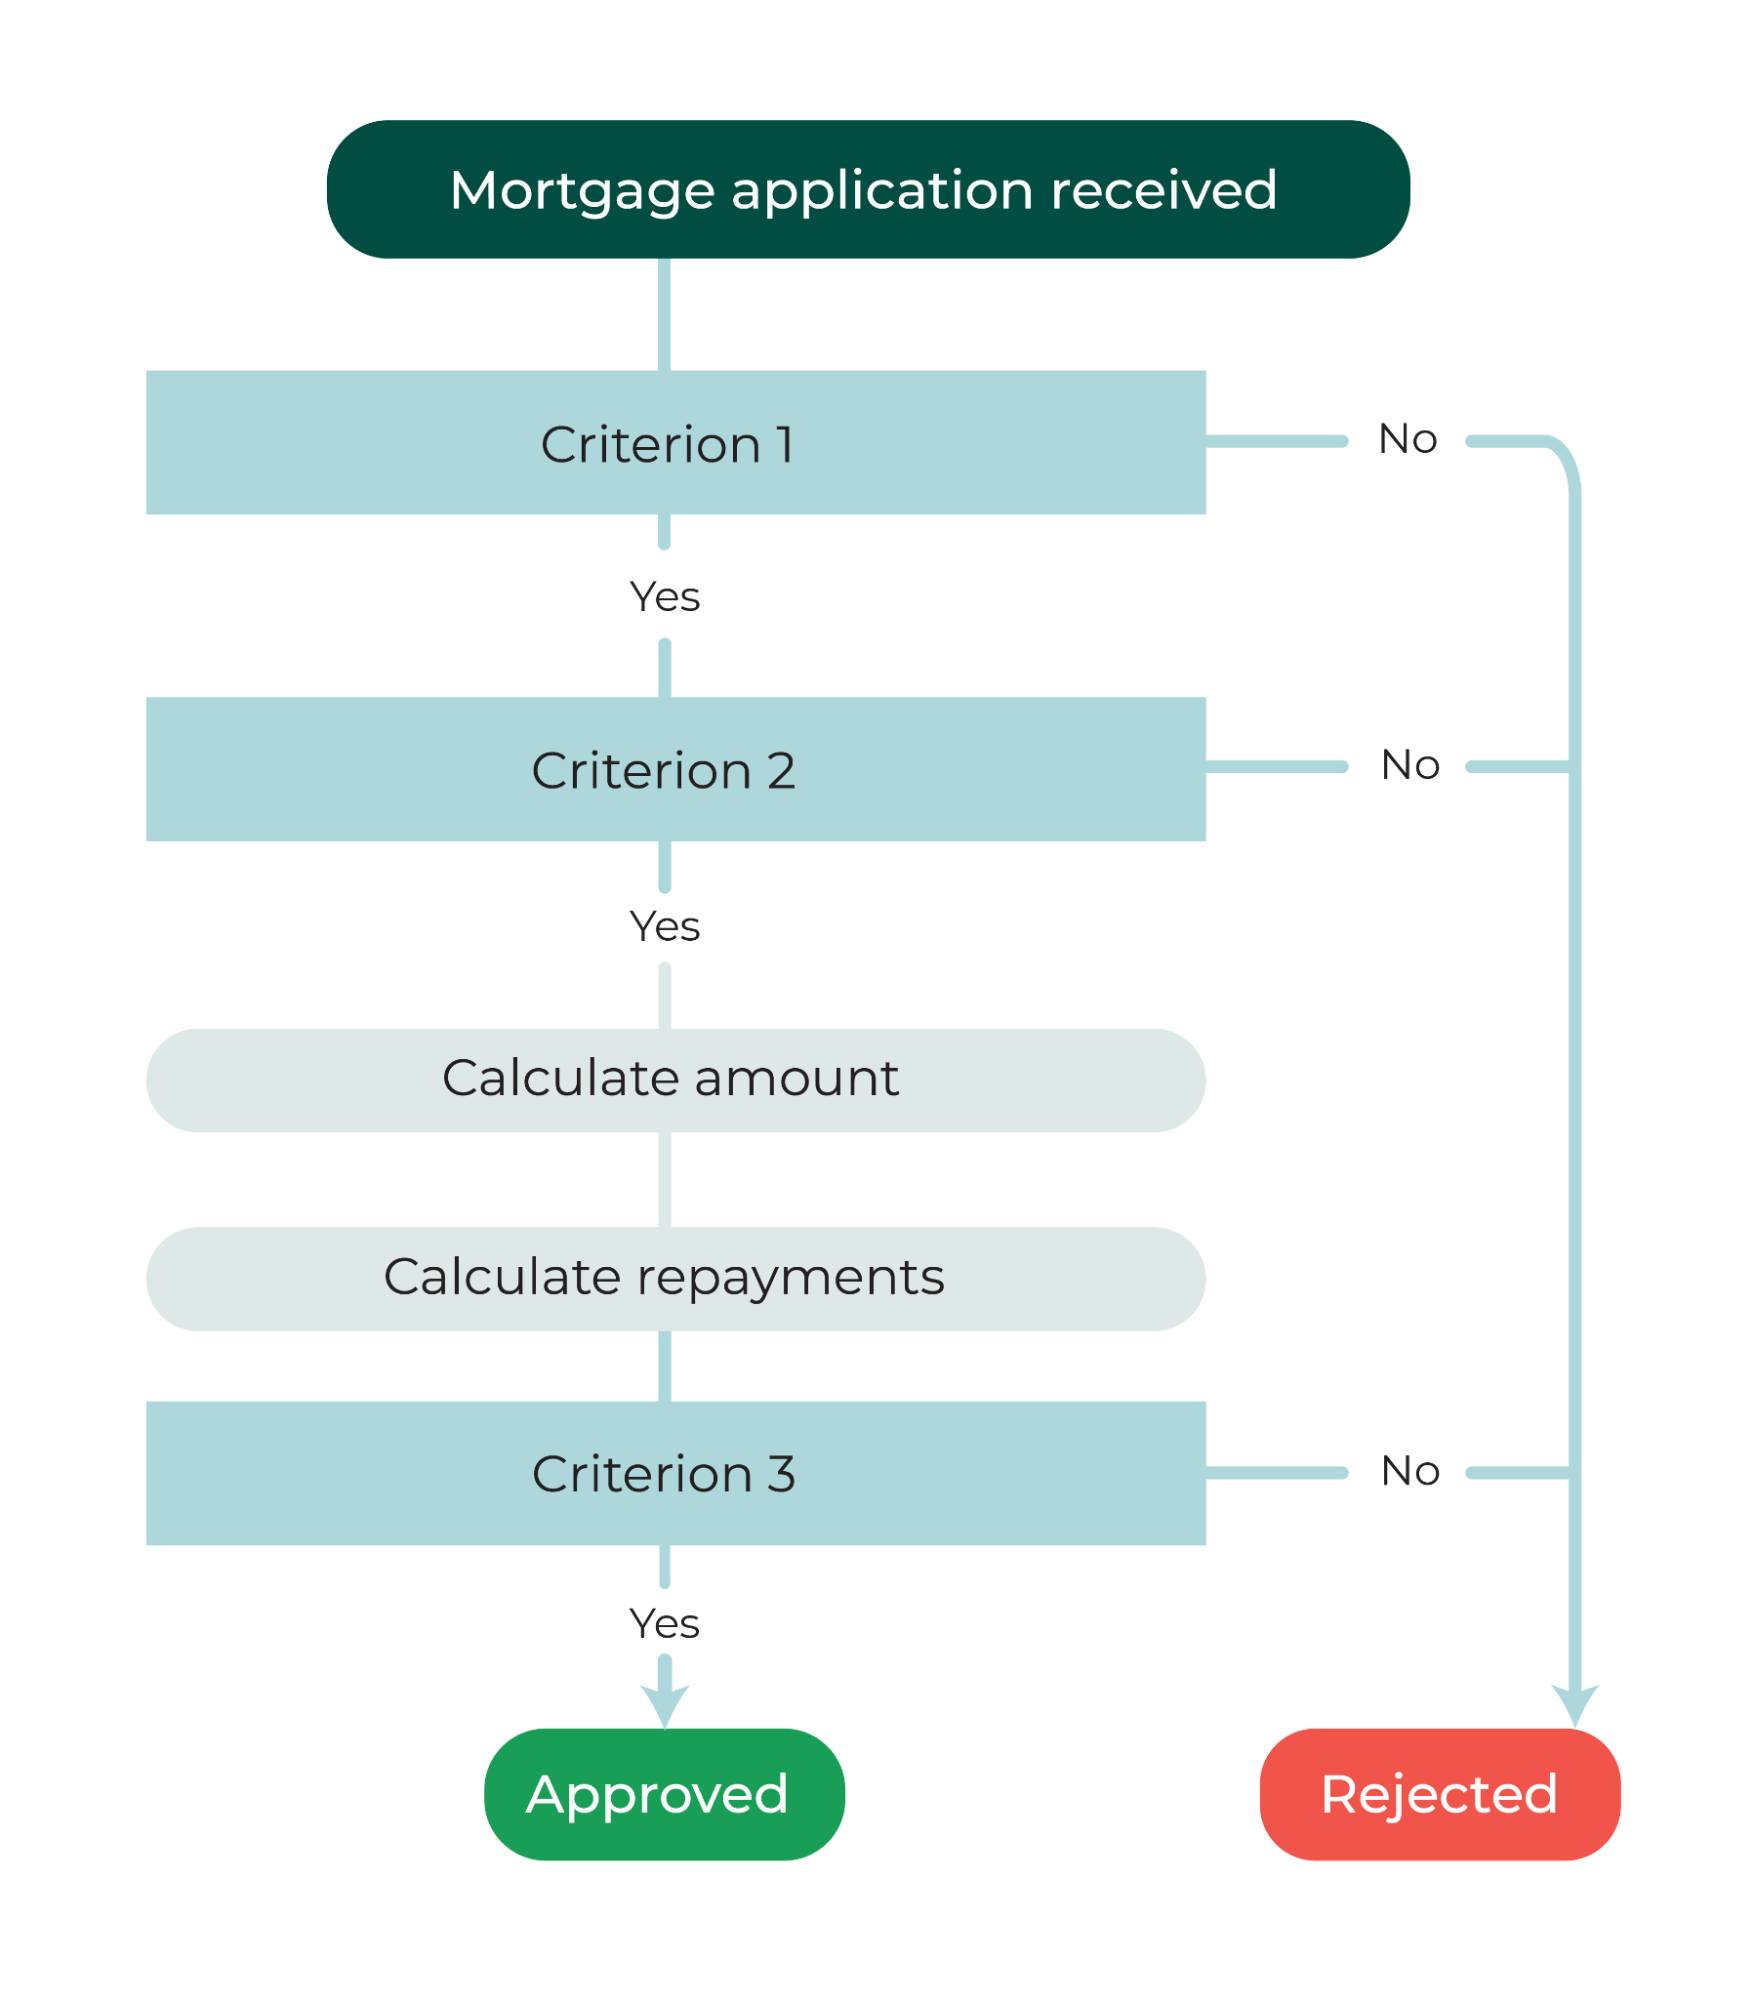
There are three eliminatory criteria:
Criterion 1
If the age of the borrower plus the length of the loan is over 82 years (life expectancy), the mortgage application is automatically rejected as it’s highly likely that the borrower will never pay back the loan.
Criterion 2
If regularity of income is at 3, which is very irregular, the application is automatically rejected.
Criterion 3
Criterion three is broken down into three stages:
You need to calculate the exact sum that Global Bank is required to contribute to the transaction, e.g., the total real-estate transaction minus the customer down payment.
Next, the bank calculates the monthly mortgage repayment by dividing the loan amount by the loan duration.
Finally, to meet criterion 3, you’ll compare the borrower’s average monthly income and the monthly repayment to decide whether they will be able to repay the loan every month. The precise calculation requires that the repayment amount be less than the monthly income divided by three plus the number of dependent children.
Let’s start with the first two criteria.
To calculate the borrower’s age or compare the regularity of income, you’ll need to use a new formula language called DAX.
What is DAX?
With DAX, you have access to various functions for creating new information from the data you’ve already imported.
E.g.:
Date and time (get a date, turn a number of days into hours or minutes, etc.).
Time intelligence (adding updates and lengths of time, etc.).
Filter (filter a table or a column according to a condition, etc.).
Logical (test to see whether a condition is met, etc.).
Math and trig (add up, round numbers, etc.).
Statistical (count a number of values, find a maximum, calculate an average, etc.).
Text (search for a value, shorten, make upper case, etc.)
Some useful DAX functions:
Math and trig functions | Information functions | Logical functions | Filter functions |
|
|
|
|
Let’s look at how to do all of this in a video, creating a calculated column to get customer age, which is used in criterion 1.
Create a Measure
You’ve already seen how to use DAX formula language to create columns.
Now let’s create a measure to calculate the total loan amount being offered by Global Bank, so you can work on the third criterion for approving or rejecting a mortgage application.
What is a measure?
Measures are a different object to the columns that you’ve used before. With columns, you create new data that is added to your data tables, whereas measures are calculations that adapt to your context.
Why are we going to use a measure rather than creating data to calculate the amount to be loaned by Global Bank?
Measures are more flexible when you want to do the following:
Later down the line, add a visualization to your measure that presents the total for all mortgage applications per year (because a measure will automatically aggregate amounts loaned per year).
Use your measure in a table with the customer list (as it will calculate the amount loaned to each customer).
In the next video, you’ll see how to create a measure for the amount to be loaned by Global Bank, which you’ll need for the third criterion.
To do this, you can use a quick measure!
And there you go! You’re now ready to calculate the borrower score.
You want to be able to provide branch advisors with clear direction.
Therefore, you will have two possible values for the score:
Conditions | If one of the three criteria is not met | If the three criteria are met |
Score value | "REJECTED" | "APPROVED" |
Written as an algorithm, the formula is as follows:
Criterion 1: IF Customer age + Mortgage length is greater than or equal to 82 then assign "REJECTED" to borrower score otherwise
Criterion 2: IF Regularity of customer income is greater than or equal to 3 then assign "REJECTED" to borrower score otherwise
Criterion 3: IF Average monthly income divided by 3 plus the number of dependent children is less than monthly mortgage repayments then assign "REJECTED" to borrower score otherwise assign "APPROVED" to borrower score.
Here is the resulting formula that will be used to calculate the borrower score:
Borrower Score = IF(LOOKUPVALUE('Family Status'[Customer Age],'Family Status'[ID_Client],'Mortgage Applications'[Customer #])>=82,"DECLINE",IF(LOOKUPVALUE('Pro Status'[Income Regularity],'Pro Status'[Customer #],'Mortgage Applications'[Customer #])=="3 : Very Irregular","DECLINE",IF(('Mortgage Applications'[Duration])>LOOKUPVALUE('Pro Status'[Average Monthly Income],'Pro Status'[Customer #],'Mortgage Applications'[Customer #])/(3+LOOKUPVALUE('Family Status'[Number of Dependent Children],'Family Status'[ID_Client],'Mortgage Applications'[Customer #])),"DECLINE","ACCEPT")))
Congratulations! 🍾
You’ve developed your borrower score!
Your hard work will help branch advisors to save huge amounts of time! On their dashboard for loan applications under consideration, they will now receive a clear recommendation for each application: approved or rejected.
The Pros and Cons of Data-Creation Methods
Let’s take a look at what you’ve learned from all this.
Using Measures
✅ For visualizing a value based on interactions with your dashboard.
✅ Quick measures are simple to use.
✅ No need to store new data.
⚠️ ️ The calculation happens in real time and can be slow (if complex and drawing on lots of data).
Using Calculated Columns
✅ For visualizing different values independent of the active selection.
✅ For reusing values as fields in a visualization.
⚠️ ️ Can require large volumes of data storage: if you have a 100,000-line table, a single column can take up lots of room.
Let’s Recap!
Measures allow you to create additional data in the form of objects that can be used in visualizations.
Calculated columns let you add new dimensions to data tables, through calculations using DAX.
It’s best to opt for measures when you want to visualize a value based on interactions with the dashboard.
It’s best to opt for calculated columns to reuse values as an intermediate stage in other calculations.
You’ve almost reached the end of this course! Just one final chapter to help you go even further with Power BI. Let’s go!
