Use Google Analytics or other BI tools to monitor user behavior
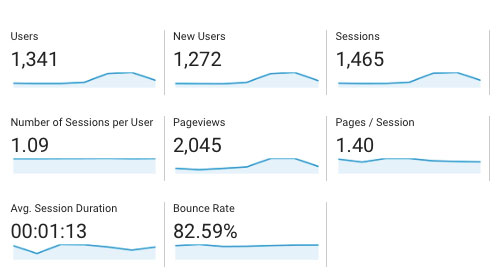
You can learn a lot about user behavior in a qualitative sense through tracking analytics. Google Analytics is a free tool you can install on any website in order to track traffic. Analytics provides information such as user location, devices used, initial page entered, and the number of pages visited.
The challenge with tools like Google Analytics is that in many ways there is so much information that it can be overwhelming. It's important to figure out which metrics are most important for each project in order to better understand users and tell a story through data.
Watch out for traps
A lot of people assume that the longer someone stays on a webpage, the better. Not necessarily. This myth doesn't consider the user experience and can lead to inaccurate assumptions. Is the user engaged with the content or are they unable to find the information they need?
Bounce rate refers to how quickly someone leaves your site. This is another instance where you don't want to jump to conclusions too quickly. A high bounce rate could be a bad thing if people aren't interested in your site content. If the visitor finds the information they need right away and leaves happy, a high bounce rate isn't bad. It's also important to note that, depending on which sector or industry you work in, different bounce rates are normal. For instance, it's typical for someone to visit a restaurant website for opening hours and quickly leave because it's all they are looking for. In the real estate market, if someone is looking to buy a house, it's more likely they'll stay and explore the site. However, if an agent sends them a listing they don't like, they could "bounce" right away.
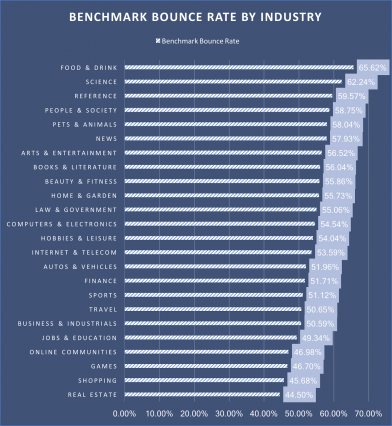
ConversionXL shares bounce rates by industry. Food and drink has the highest bounce rate, while shopping and real estate are the lowest.
Both of these scenarios explain why it's important to consider metrics that are relevant to your business or product. It's also why conducting usability tests is highly valuable, as you can observe behaviors and uncover issues you may not have considered or weren't apparent in the data.
Key terms in Google Analytics
Google Analytics is a robust tool. You won't master every feature overnight, so instead of trying to do it all, look for the features that will tell you most about your users. Here are some key terms you may encounter:
Users – visitors who engage with your website
New vs. returning visitors – people coming to your site for the first time versus those who have visited at least once before (note: someone may check a site from a different device or computer that is not their own. They'd be seen as a new user.)
Segment – subset of users (for instance, users who are female, live in a certain region, and are a defined age group)
Session – according to Google this is “a group of interactions that take place on your website within a given time frame. For example a single session can contain multiple page views, events, social interactions, and e-commerce transactions. You can think of a session as the container for the actions a user takes on your site.”
Entrance – the first page a visitor to your site enters on
Pageviews – the number of times a visitor views a page
Time on page – average time (in seconds) a visitor spends on a page
direct vs. referral traffic – visitors who come to the site directly using your web address vs. being linked through another site or social media
Organic search vs. paid search – visitors who land on your site from search engines as opposed to paid search where sponsored links lead someone to visit your site
Events – customized actions to track activity on a page such as clicking links, downloading a file, or pressing play
Funnel – a way to visualize and analyze a customer's journey or user flow (registering for a new account or making a purchase). This is useful for seeing where customers drop off.
Goals – how often users complete specified actions (for instance, getting to the confirmation page of a website is a signal that they've made a purchase)
Google Analytics works by embedding a tracking code on your website pages. It's a bit technical (in the real world you'd likely work with a developer), but this video from the Google Analytics Academy will give you a better understanding about how data is collected.
How Google Analytics collects data (5:39 min)
Watch data for insights
Use business intelligence tools in order to make sure everything is working as usual, and to ensure that any updates to the site result in the change you desire.
Let's say you're monitoring your analytics and notice an unexpected drop in traffic. You talk to your product manager and decide to review the JIRAs [a project management tool for managing tasks] from that time. You notice there was a new feature released around the time of the drop-off. As you take a closer look, you realize that there was an oversight and a key navigation button was left off the page, a link went to the wrong page, or the microcopy was changed in a way that confused users. It's a good thing you checked the analytics because otherwise, this problem could have led to serious financial troubles!
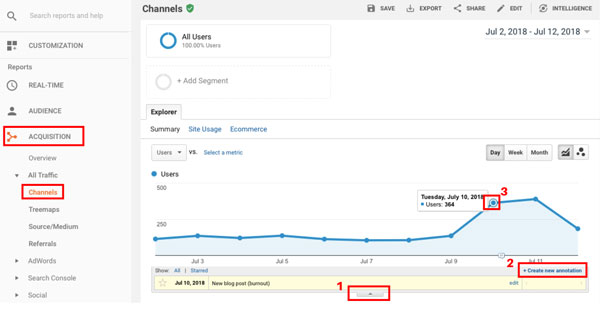
Google Analytics lets you add annotations to points on the graph. In the future, you may want to mark key dates so you can keep them in mind as you watch what happens to traffic. You could add notes when features are released when the company appeared in the press, or you published a blog post and shared it on social media.
Keep in mind that growth can be affected by holidays, or different times of year may yield higher returns for different industries. For instance, universities may have less traffic in summer, and it will pick up again closer to back-to-school time.
As you implement design updates, consider creating segments to track any online behavior changes in a certain type of user. This can be helpful if your project targets a specific type or group, or if you're trying to determine your core user base.
In addition to adding annotations on the Google Analytics charts, you can also use Google Tag Manager. This tool allows you to put "flags" in the code that help you track when a user starts and stops a certain behavior. This is likely something the product manager and developer would spearhead, but it's useful to be aware of as a designer.
Examine experiences through funnels
A common place you may encounter drop-off rates in a user experience is in e-commerce when a user is about to make a purchase. They are often taken to a third party site to make a payment, such as PayPal, which can disrupt the flow (and look) of the experience. Watch for where users are dropping off, then you can determine why.
Funnels are another way to capture specific metrics about the user flow. These can be used for things like e-commerce purchases, registration pages, or onboarding where users drop off before signing up. Funnels allow you to prioritize and focus on improving the areas where drop off is occurring. They can help ensure users are able to complete tasks successfully.
The best way to set up a funnel is to work backwards and consider your biggest goal. From there you can break down the steps to achieve the goal and make sure that you're collecting data at each step.
Let's recap!
Business intelligent (BI) tools can teach you a lot about user behavior through metrics.
Don't fall into the trap of assuming that a long time spent on a page is always a good thing, or that a high bounce rate is a bad thing.
Monitor your analytics to make sure nothing unexpected has happened as you've released new features.
There are many ways to track analytics. Think critically about your product needs and what information is most important to capture.
