Measure user performance in usability testing
Usability testing is another common way to capture performance metrics of a product. Together with analytics, you can combine what you've learned to obtain even more insights into the user experience. While we've already explored how to gain qualitative insights from usability testing in terms of how users think and interact with a product, this chapter will explore the link with analytics quantitative side of performance metrics.
Bridging analytics and usability testing
The Nielsen Norman Group describes analytics—such as Google Analytics—as a way to help you understand what users are doing in the wild, in an inexpensive way. By contrast, usability testing is more experimental which allows you to control the conditions, which results in a richer picture of what's happening with your website.
Analytics vs. quantitative usability testing [2:03 min]
Analytics data is good to help identify possible issues, and usability tests are a way to help understand and validate any hypotheses by watching users interact with the product. Analytics tells you what is happening, but usability tests can help you understand why it is occurring.
Turning analytics findings into usability studies. [2:50 min]
The Nielsen Norman Group recommends framing usability tests to help recreate the patterns you see in the analytics when translating UX issues from analytics into user research. Sometimes it will be obvious where in the flow users are dropping off, and that's the area you'll want to examine and test. When users aren't even starting the flow, you may want to do a more open-ended test to see what's happening.
Examine task success
Task success is a way to understand how users are interacting and engaging with your product from a quantitative perspective in order to uncover trends and decide where to prioritize your time.
Task success considers whether or not a user completed a task. You may want to break it down in terms of:
User successfully completed task
User partially completed task
User did not complete task
It can be helpful to define each of these categories as well, as they may vary depending on the type of product you're developing. Make sure everyone on the team is on the same page.
It is important for your team to define what success means prior to collecting data. Establish and agree on a standard of success. Does it mean getting a user to sign up, engage with an advisor, or sign up for a newsletter? What if the participant takes too long? It all depends on your product.
You also need to know what constitutes the start and end of a task. Is it when the visitor clicks the first video, or is it after the video is complete? This information is also crucial in determining the behaviors in which you measure UX metrics (which we covered in chapter two of this course). Does a task end when a customer puts something in the cart, or when the purchase is complete, and the confirmation screen appears? Start and end points sound like they should be obvious, but depending on your product goals, there can be room for interpretation.
Record task completion rates in a simple table where you can look for trends and see where users seemed to get stuck. When you see users getting stuck or frustrated at a certain point of the flow, that's likely an area you'll want to revisit.
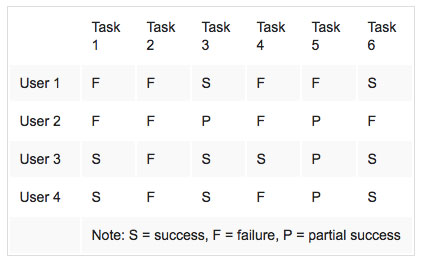
This simple task success chart from the Nielsen Norman Group highlights various tasks that were tested on four different users. Each one is noted S for success, F for failure, or P for partial success. To take this chart a step further you could label the tasks with more specific information, or tally (or average) the various for each level of completion.
When tasks are clearly defined, you'll be better able to talk about success rates. When users aren't successful at completing a task, you'll know that's an area to continue making product improvements.
Track efficiency and errors in usability tests
It's important to remember that just because a user can complete a task doesn't necessarily mean they had a good experience. Another way to look at experience is to measure efficiency. You can do this by tracking how long it takes a user to complete a task. Time on task can help unlock insights regarding a user's experience. If they spend four minutes on a task, but you know it can be completed in less than one, that may be a sign that there is something in the user flow you want to revisit.
Similarly, you may want to record how many errors they encountered. The more the user gets stuck, the more they're likely to leave the site—and never come back. Errors can also show you what may be confusing or misleading for users.
Both task efficiency and errors encountered are best recorded through usability testing. Sometimes seeing is believing! When you see it for yourself, you gain empathy for the user. In addition to observing, consider what you can quantify in order to bring richer data back to the rest of the team.
You can follow this information using simple tables. In addition to tracking the participant, task completion, or success, you also can include averages as a means of compiling information at a glance.
First impressions matter
Quantifying tests through time is a way to think about how users perceive products. Five-second tests help us better understand users first impressions by asking them what they remember after only seeing a site for a short time.
Testing first impressions [2:30 min] We'll be exploring A/B testing which was mentioned in this video in chapter 6 of this course.
Let's recap!
Usability tests can provide you with both quantitative and qualitative data. Paired with other information, such as analytics data can help you make even more informed decisions.
Task success is a helpful measure for ensuring that users are able to complete tasks.
It's important to consider how efficiently users are able to complete tasks. If it takes too long, or is not memorable (or learnable), then they may give up or never come back.
Remote usability platforms make it easier (and more affordable) to reach a wider audience to test on.
