Tell a story though data
Using data and numbers can get the attention of key decision makers as it's often something they can relate to. In addition to numbered charts, graphs and data visualizations are ways to visually present information and show trends. Whether you're visualizing the collected data or applying design skills to create effective data visualizations, it's a valuable skill. It can help ensure you get your point across and attract awareness to your endeavors.
Sometimes data can seem overwhelming, but it doesn't have to be. It's helpful to think of it as a tool for communicating information. When it comes to presenting data, it's important to consider what story you want to tell.
Voices in data visualization
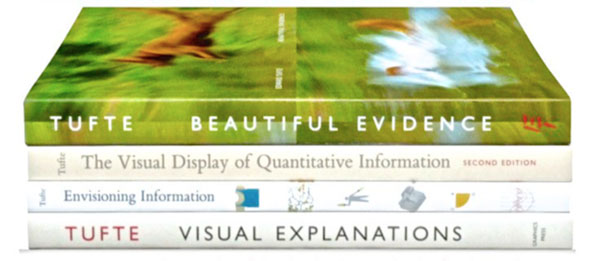
Edward Tufte is a statistician specializing in the visual presentation of data. He has authored four books: Beautiful Evidence, The Beautiful Display of Quantitative Information, Envisioning Information, and Visual Explanations. He uses the term "chart junk" to explain all the meaningless clutter and excess information that distracts from truly understanding the data in front of you. His approach to data tends to be clean and minimalist. His goal is that viewers see the data before getting distracted by the graph.
Edward Tufte is very proprietary about content, so it's harder to come across images of his work online. However, you're likely to find his books in offices or libraries, and his day-long seminars are very popular across all industries. Next time you see one of these books on a shelf, take the time to flip through.
David McCandless is a self-proclaimed writer, designer, art director, and artist who is well known for his work in data visualization. His books Information is Beautiful and Knowledge is Beautiful are colorful and bold looks at all kinds of unlikely data sets. He strives to create visualizations that look cool and catch your eye, but also tell a story (like his visualization of colors across cultures). On the web, his work is often interactive, which allows for data to be viewed in multiple contexts across a single graph. By selecting different categories or years, the data in front of you moves to tell a different story.
The beauty of data visualization with David McCandless. [21:27 min]
The work of information designer, artist, and author Giorgia Lupi takes a completely different look at data using human stories and drawing her visualizations by hand. Her first book, Dear Data, was a collaboration with her friend, Stefanie Posavec, where they sent postcards to each other with themes they decided on, and each interpreted in different ways. Her work is a good realization of how much data around us is far more complicated than it needs to be.
How we can find ourselves in data with Giorgia Lupi. [11:14 min]
Keep it simple
Sharing all the collected data that isn't very interesting. You need the data relevant to your project, and you need to present it in a way that is convincing, contextualized, and easily understood by others (we'll look at how to do this more in the chapters to come).
It's tempting to want to get creative with your data visualizations, but particularly as you're starting out keep in mind that sometimes the best data representations are the simplest. Go for clarity and simplicity. Viewers don't always have a long attention span, so you need to focus on the fact that they are correctly interpreting the information you are putting in front of them. And remember to let the data inform your decisions.
Let's recap!
Tell a story through the data you collect.
Think about the data you have when determining the story you will tell.
There are many different approaches to presenting data, but always try to air towards simplicity.
