Track Your Goals Over Time
What Are Your Goals?
What goals did you have in mind when you started this course?
Get a brand identity?
Make your content visible?
Connect with your community?
Create attachment and engagement?
Drive traffic to your site or to a point of sale?
Get recommendations?
Create societal change?
Identify allies?
Provide service to your community?
Solve your customers' and prospects' problems?
Create brand preference?
Foster discussion between the community members?
You can, of course, pursue several goals. If you do, rank them from the most to least significant and from the most to least urgent.
For example, you represent a new service that has unhappy customers. In short, you're unknown, and your Twitter mentions are 90% negative. It's undoubtedly very important to build brand identity, but more urgent to stop the issues by providing a service to your community.
Behind each of your goals, there is a way to measure your progress.
Here are some performance indicators (KPIs) to keep in mind. Prioritize and complete them according to your goals. As you achieve a satisfactory performance level for urgent criteria, you can shift your efforts to new goals.
Objective pursued | KPIs to monitor |
Assimilate your brand identity |
|
Make your content visible |
|
Create attachment and engagement |
|
Be in direct contact with your community |
|
Drive traffic to your site or to a point of sale |
|
Facilitate recommendations |
|
Induce societal change |
|
Identify allies |
|
Provide service to your community (brand utility) |
|
Solve the problems of your customers and prospects |
|
Create brand preference |
|
Foster discussion between the community members |
|
Even if you or your CM listens to the community daily, it's important to measure your performance regularly. Not to distribute good or bad points, but primarily to assess how you allocate your efforts. The decision to continue, stop, slow down, or intensify posts related to the traffic to an e-commerce site is an important one:
Intensifying them: your engagement rates may decrease, your community may shrink, your average click rate may decrease slightly, and your traffic and income would likely increase.
By reducing them in favor of more conversational posts: your engagement rate, community, awareness, and average click rate will increase. But your traffic in absolute terms and your income will drop slightly in the short term.
If you are more of a seasonal organization, it's interesting to reduce these posts attracting traffic during the year and intensify them during peak times.
For example, Interflora is very conversational most of the time but becomes more direct closer to Valentine's Day, Mother's Day, and other important dates that call for flowers.
It doesn't stop at the number of posts. You can decide to change the content to be more or less direct or conversational.
Which Tools?
Some third-party tools also provide valuable statistics and generate faster reports than you can produce them. Again, it all depends on your organization.
If you have many social spaces (networks, markets, brands) and must regularly convince your managers of your performance on social media, this can be a good opportunity. Otherwise, it may be easier to stick to the reports posted directly on each network. These are generally complete and easy to understand. You are then free to add figures manually.
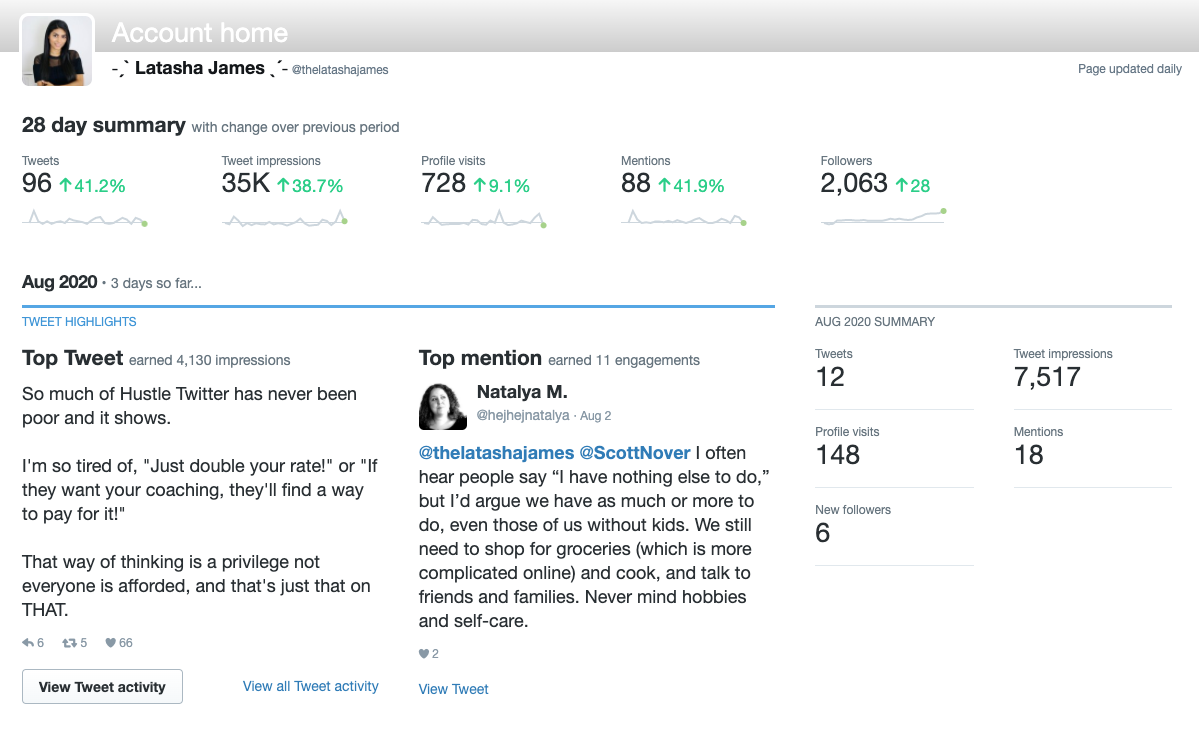
For example, here is an overview of a monthly mini-report that Twitter automatically generates:
If you want to compare each of your networks' performance, you'll need some key report figures you will do yourself.
Here are the primary cross-platform KPIs:
Impressions: how many people see your posts.
Interaction or engagement rate (interactions/scope of content): how many of your viewers take the time to interact.
The sharing rate per post: gives you an idea of the quality of these interactions. Sharing content is very engaging in the true sense of the term. These people allow your organization to speak through their profile, which is the ultimate engagement.
Size of the community: this sometimes anecdotal figure still indicates brand attachment. It gives you an idea of the scope you would have, in theory, if all of the people were engaged and connected at the same time.
Here's a very concise reporting document that fits on two screens:
One for primary KPIs: the four indicators above, for three networks.
The other to identify the best posts: those with the most reach, all networks combined. Then those receiving the most interaction by network.
If you already have a social media presence, try completing it using information from your networks. Sometimes you will need to export the data into raw formats (*.xls or *.csv).
Also, judge for yourself how to modify this document to your goals (see the previous section). The value of this document depends on the person or department it's geared toward.
For example, present the key figures to people unfamiliar with social media. Do not show detailed variations to your senior management. They will be content with the big picture. Depending on the context, you can also add a screen with posts that have been less well-received. It will keep you from repeating mistakes.
Develop your own method, and work directly with the data from each network. But don't be closed minded: new tools appear regularly, and you should try them as they could save you precious time. But if you do change tools, make sure that the data is compatible. In the future, you might want to compare a figure to its equivalent in the past.
Develop Your Strategy
Study the positive and negative results and adjust your strategy accordingly based on your reporting and weak signals such as the change of atmosphere within the community or post that triggered more or less positive comments than usual.
Your community can demand this type of content from you or reject it. This space is also theirs. It's easier for the community to change, unlike you. So it's up to you to adapt and catch their attention.
Operate in a test & learn mode. If a theme does not work, review your publication schedule. If the problem persists, question your editorial line or your value proposition.
It's important to study successes as well as failures. Bring your teams together regularly to adjust your strategy. And stay in touch with the community to find out what interests them. If necessary, consult with some members transparently: what do you expect from this account? What content, info, or videos would you like to see or share?
Never stop observing and always question yourself. A good practice is to periodically replace the least performing theme of the period with a new one.
Publication time also has a role in a post's performance. But in this particular case, it takes a long time to determine a general rule.
Don't Over-Interpret Results
You no doubt have a certain statistical rigor. So be careful not to draw conclusions that are too definitive regarding a performance measured over a limited number. Context quickly changes, and social media is not an exact science. If you believe in a particular theme, but your first posts didn't have the expected success, it might have been bad luck. If there is other evidence to confirm your intuition, test it again. If it doesn't take off as time passes, then abandon it.
The typical example concerns the publication dates and times. If you post continuously, you don't have that concern. But if you schedule your periods of communication, you are bound to wonder when is the best time to post.
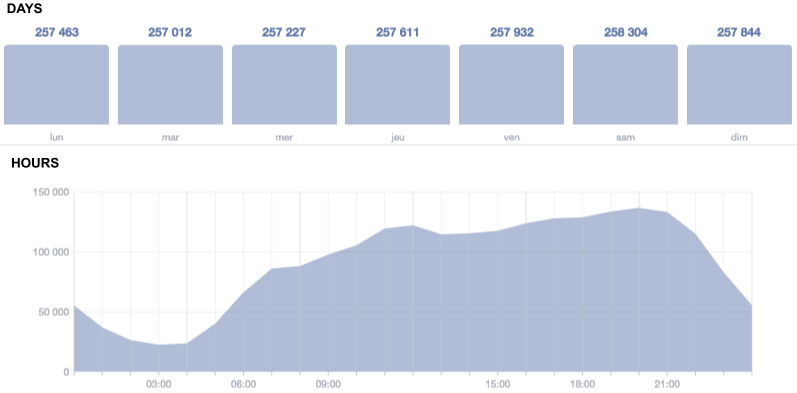
For example, pay attention to the graph showing when your Facebook community is online. It's the same for everyone. It's in the shape of a hat or an elephant inside a boa constrictor (depending on your perspective). You can verify this on your Facebook statistics page if you have one. It means that you would be tempted to publish all your pages simultaneously and face stiff competition.
Here are the times when Facebook communities connect:
Of course, your community is more responsive at times than others. Engagement impact and post visibility depend on it. But do not take this data literally. Imagine that you had good performances on Monday, Wednesday, Friday at 8 a.m., and Sunday at 11 a.m. By publishing only at these times, you take two risks:
Ignore people logging in on Tuesday, Thursday, and Saturday.
Ignore people who connect in the evening or around mealtimes.
Not testing and learning from other schedules.
Publish all night long in New York if you have a part of your community there.
Have too much rigidity in your organization: if the content is approved on Monday evening, for example, it cannot be published before Wednesday at 8 a.m.
Some tips to avoid these situations:
Choose to prohibit some times: if, for example, you notice that Friday afternoons/evenings give you poor results, don't publish then.
If you've noticed a better time of day to do things, go with it, but don't get stuck. For example, post one-third of your content during these favorable times and the other two-thirds at other times. You may find a new favorite time slot.
Post during the reverse of office hours: before 9 a.m., during the lunch break, after 6 p.m. and until evening - except on LinkedIn and professional networks.
Imagine the lifestyle rhythm of your community, form, and test a hypothesis. If you are talking to stay-at-home parents, try to aim for 9:00 a.m., the time that they've already brought their kids to school and can relax. Or 9 p.m., after the kids go to bed. If you spot a trend, you know what you need to do.
Finally: occasionally break these rules. Post a few times a year on a Friday evening as a test.
Let's Recap!
Beware of the trap of reporting for the sake of reporting. You will only perform on what you measure. It is essential to measure the correct metrics. Depending on the results, be flexible: measure your performance and periodically question your strategy.
But social media is not an exact science.
The numbers don't lie, but you need to use common sense to read them correctly. With experience, get better at combining the results with your intuition to make an informed decision.
There is one last step before you finish. Have you guessed it? Finish the last part of your social media marketing mix strategy! I hope you enjoyed this course as much as I did. Can't wait to see your social media marketing take over the internet!
