Monitor Your Systems
Mike is still with you the next day—he’s refusing to leave until you find a way to monitor the status of your machines and trigger alerts. Thankfully, AWS already has some tools to help you set this up, so you should have your desk to yourself again soon! This is what you’ll learn in this chapter.
Discover CloudWatch Metrics for EC2
EC2 has a range of metrics in the Monitoring tab, above the description of your instance:
These are the standard metrics sent by all the EC2 instances in your account without you having to do anything. There are two types of monitoring:
Basic: Data is made available every 5 minutes at no extra cost.
Detailed: Data is made available every minute for an additional cost.
Metrics are also available in the CloudWatch control panel. To access it, go to the CloudWatch service or the EC2 screen, click on View all CloudWatch metrics, and you’ll be redirected.
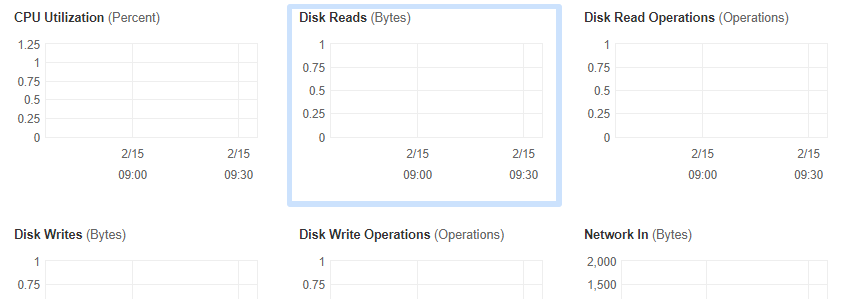
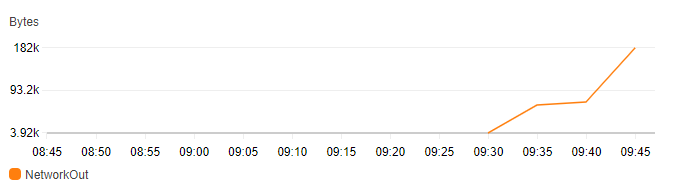
In the CloudWatch panel, click on Metrics, and then search for an instance as follows:
Click on EC2.
Click on Per-Instance Metrics.
Search for the ID of your instance using the input field.
Select the metrics you want to display.
You’ll end up with a graph like this:
Create Your First Dashboard
There’s a service in CloudWatch that you can use to create a visual overview of your system’s metrics—the dashboard function. Click on Dashboards on the left, then on Create Dashboard. Choose a name, then click Create.
You can add items to your dashboard like this:
Click on Add widget.
Choose a display type, for example Line.
Click on Configure.
Choose your metric as required.
Repeat these steps to add more items.
After you’ve added everything you need, click on Save dashboard, and you’ll get something like this:
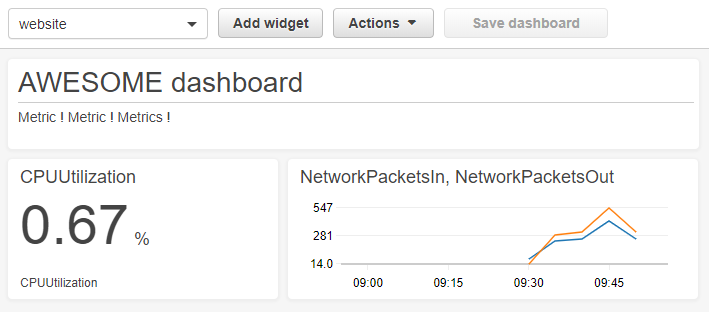
A dashboard is great for keeping an eye on what’s going on, but you’re probably not going to spend your whole working day looking at graphs. Mike suggests a way of receiving alerts that run when network traffic exceeds a certain threshold, called CloudWatch alarms.
Create a CloudWatch Alarm
CloudWatch has a feature called CloudWatch alarms.
You can then configure actions to take when the status changes from OK to ALARM.
You need to choose a metric to monitor when you set an alarm. To do this, follow these steps:
In the CloudWatch service, click on Alarms, Create alarm.
Click on Select Metric.
Click on EC2.
Click on By Auto Scaling Group.
Click on the metric NetworkPacketsOut for your auto scaling group.
Click Select.
You’re now going to configure a threshold for the alarm so that it goes off when the number of outbound packets reaches 1000. To do this, choose a name for your alarm and set the following parameters:
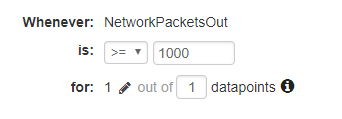
Leave the other default parameters. In the Actions section, click Remove to get rid of the default action—you’ll add a different one later. Click next, give the alarm a name. Click Next again, then finally, click Create alarm.
Once created, your alarm will look like this:

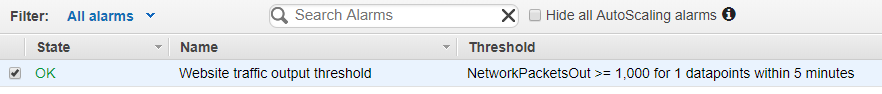
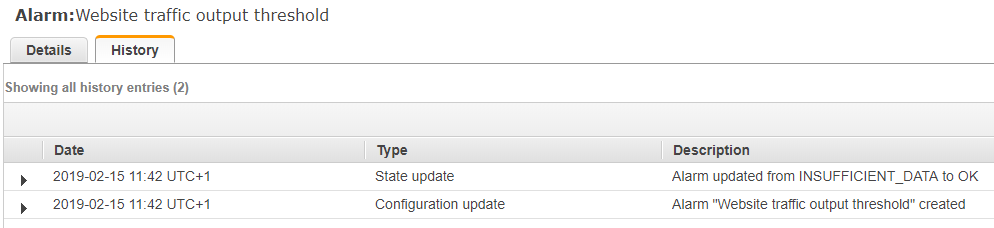
You can see what’s happened in the history under the alarm:
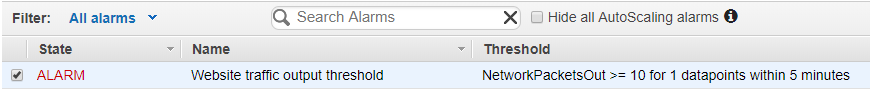
Let’s simulate an alarm. You need to bring the threshold down to a very low level, and generate some traffic to do this. Highlight your alarm, click on Actions, Edit, and lower the threshold to 10. Click on Update alarm. Then, go to your website, refresh the pages several times, and wait a few minutes. The alarm should change to the status ALARM.
You can put the threshold back up to 1000 for the next bit.
The alarm is working, but it doesn’t notify you if the threshold is reached! To do this, you need to add an action to the alarm. Here’s how:
Send Emails When an Alarm Goes Off
The CloudWatch alarm system is based on a service called Amazon SNS (Simple Notification Service). This service provides a fully managed, serverless notification mechanism. It works like this:
Create a topic in Amazon SNS that receives the information that the alarm threshold has been exceeded.
Subscribe to this topic with your email address. This email address must have been verified, as you’re in the AWS email sandbox.
Tell the alarm to carry out an action when the threshold is reached, propagating the event to your Amazon SNS topic.
It’s fairly easy to configure an email alert when the threshold is reached. However, because you’re going to use the Amazon email service, you need to confirm that the email address belongs to you. This mechanism helps AWS protect itself against spam.
Follow these steps to add an email notification:
Click on your alarm and choose Actions then Edit.
Scroll to the bottom of the page and click Next.
Click Add Notification.
In the section Alarm state trigger, choose In alarm.
Select Create new topic and set a topic name
Add your email address and select Create topic.
Ensure your new topic is now set as the destination for the notification.
Click on Update alarm.
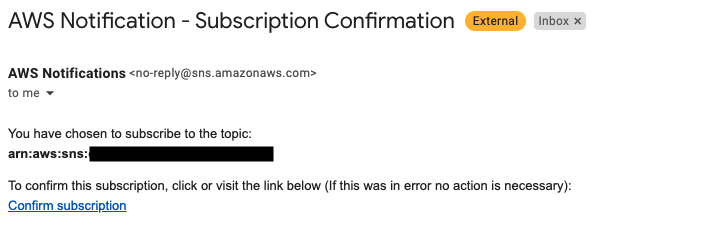
You’ll be asked to confirm your email:
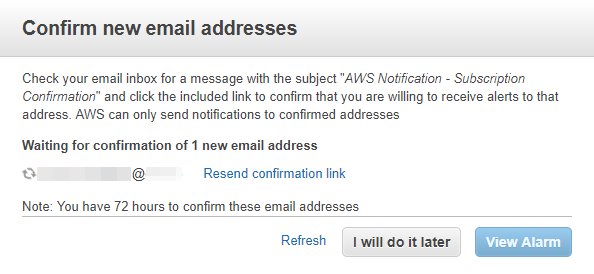
Go into your email inbox and click on the confirmation email:
You’ll receive a message confirming your subscription:
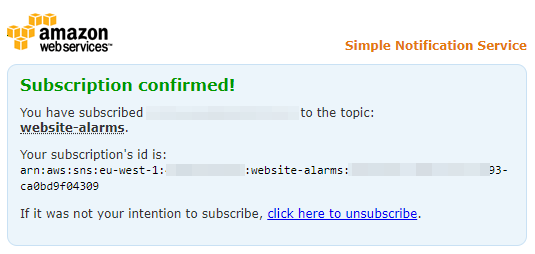
You’ve now created an action linked to the alarm that sends a message to a topic in Amazon SNS. You’ve automatically created a subscription to this topic, which sends an email to your address.
It’s time to test the email notification! Raise the threshold so that the alarm changes to OK, then lower it so that the threshold is exceeded. If everything goes to plan, you should receive an email with the name of your alarm as the subject:
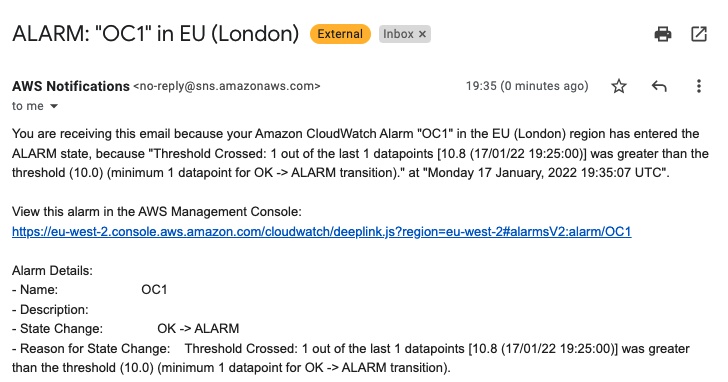
Mission accomplished! You and Mike will now be notified whenever the level of network traffic is too high in your group of machines. Mike has finally gone back to his office, and everything’s back to normal. But not for long—you’ve received an email from the monitoring team that they identified a vulnerability in the Linux system where your machines are, and an urgent update is required. This means you need to learn how to carry out an update—and that’s what the next chapter is all about!
Let’s Recap!
The EC2 service contains metrics that provide an overview of the use of certain system components, such as CPU or network load.
There are two types of metrics provided by EC2: basic and detailed.
You can create a dashboard containing different metrics.
To be notified if a threshold is reached for a certain metric, the first thing to do is create an alarm.
Then, link an action to the alarm to notify Amazon SNS.
Emails are sent via subscription to a topic in Amazon SNS.
To send emails automatically, you first need to verify the email address if the account is in the email sandbox (which is the default status).
