Monitor Your Network
You now have a highly available system and network infrastructure in AWS. But for some reason, your website is very slow this morning. You’ve tried adding additional instances and even increased the size of the database, but nothing has worked, and your boss is starting to get frustrated with the user complaints coming in.
You happened to have lunch with Mike from the CSRIT (computer security incident response team) today, and you told him all about your problem. He’s intrigued and stops by your office after lunch to see if he can help you fix it.
Mike’s a nice guy, but after a while, you start to get tired of all his questions. “How do you analyze network frames? How do you store machine logs? What mechanisms do you use when an anomaly is detected?” Finally, you end up admitting that you don’t actually know anything about that side of things. Since he’s an expert at this, he shows you what to do!
Maintain and Query a Network Log
Collect Data
The first step in troubleshooting a problem should always be to get a clear understanding of what’s going on, and for this, you need information. The easiest way of collecting information about your network is to set up passive listening (i.e., observe the packets traveling through the network). You can use several tools to do this, such as Wireshark. In AWS, there is a ready-to-use tool called VPC Flow Logs.
You’ll need to create a place to store your network logs to start. There’s a choice of two destinations for the network logs generated by VPC Flow Logs:
CloudWatch Logs
S3
Let’s send your logs to S3, as there will be a lot of data to store, and storage is cheaper in S3 than in CloudWatch Logs.
Go to the S3 interface, create a bucket, and then give it a name. Go back to the VPC service and click on VPC.
In the panel below the description of the VPC, you’ll find the configuration for flow logs.
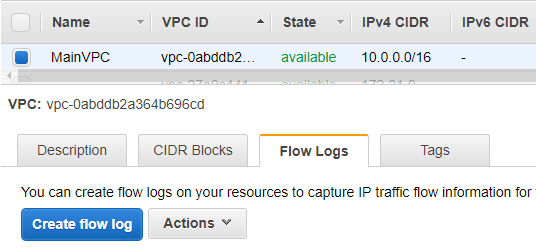
Click on Create flow log and configure it as follows:
Filter: All
Destination: Send to an S3 bucket
S3 bucket ARN: The ID of the bucket created previously, in the format arn:aws:s3:::bucket_name
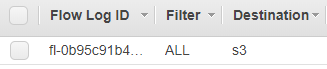
Click on Close. The connection is now in place:
Wait a few minutes and go into the bucket. You should see that some files have appeared.
You’ll notice that AWS has provided you with a bucket policy so it can publish items stored in the bucket.
Retrieve Data From Logs
Download one of the files in the folder:
AWSLogs/_account_id_aws_/vpcflowlogs/_region_/_year_/month_/_day_
and decompress it. Once the columns are in place, it should look like this:
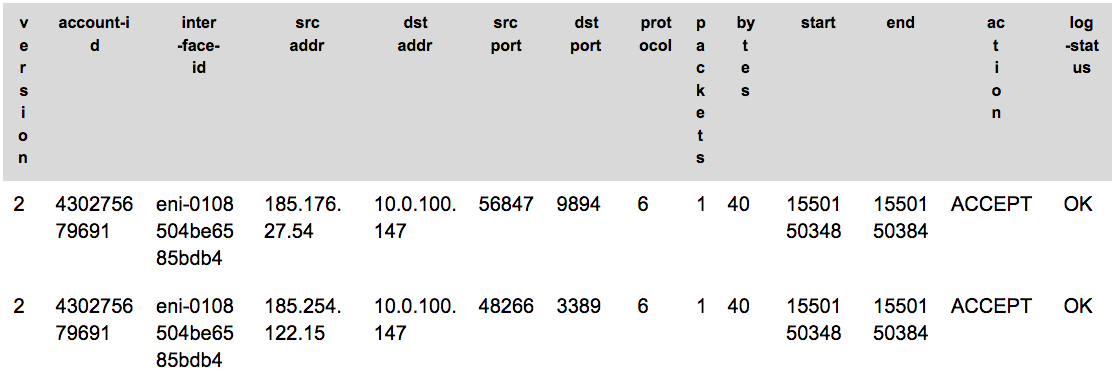
What are all those numbers?!
This information details what’s happening in your network. Each connection, whether accepted or rejected, generates a line. This line is then associated with other lines of the network logs to form a file that is stored in S3. In production infrastructure, you’ll have a huge number of these lines, and you’ll need to use the combination of AWS Glue & Amazon Athena or a tool such as Splunk to analyze them.
Search the Network History
When there’s a lot of traffic, you can use Athena to search for items in the logs.
To start, go into the Athena service via the Services tab as usual. First, like in a classic database, you need to create a table that will contain the data for your network traffic. To do this, run the following command in the Query window, replacing:
your_log_bucket with the name of the bucket.
123456 with your AWS account number. If you don’t know it, you can find it in a subfolder in the bucket.
eu-west-2 with your VPC’s AWS Region (eu-west-2 corresponds to London).
CREATE EXTERNAL TABLE IF NOT EXISTS vpc_flow_logs (
version int,
account string,
interfaceid string,
sourceaddress string,
destinationaddress string,
sourceport int,
destinationport int,
protocol int,
numpackets int,
numbytes bigint,
starttime int,
endtime int,
action string,
logstatus string
)
PARTITIONED BY (dt string)
ROW FORMAT DELIMITED
FIELDS TERMINATED BY ' '
LOCATION 's3://your_log_bucket/AWSLogs/123456/vpcflowlogs/eu-west-2/'
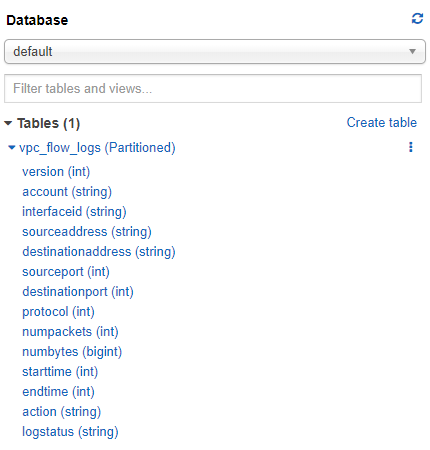
TBLPROPERTIES ("skip.header.line.count"="1");Then click on Run query. This command creates a table called vpc_flow_logs with all the columns needed for the network logs.
Once complete, you can find your table in the panel on the left-hand side:
You’re going to need to create a partition for today’s date to be able to query your data.
Run the following query, replacing:
your_log_bucket with the name of the bucket.
123456 with your AWS account number. If you don’t know it, you can find it in a subfolder in the bucket.
eu-west-2 with your VPC’s AWS Region (eu-west-2 corresponds to London).
YYYY with the current year.
MM with the current month.
dd with the day you want to query.
ALTER TABLE vpc_flow_logs
ADD PARTITION (dt='YYYY-MM-dd')
location 's3://your_log_bucket/AWSLogs/{account_id}/vpcflowlogs/{region_code}/YYYY/MM/dd';Once the database and the partition are in place, you can run queries inside the database. For example, to understand what’s blocking a network flow, you can search for the requests rejected from your VPC, like this:
SELECT *
FROM vpc_flow_logs
WHERE action = 'REJECT'
LIMIT 10;Go a Step Further
As you’ve seen, it’s quite a long process to create a partition for each day you want to query. There’s a service called Amazon Glue that you can use to automatically index the data from your S3 bucket, browse data and send new data to your Athena base. You can find more information on this in the official documentation.
Identify Network Incidents
There seems to be a lot of network traffic traveling through the Cat’s Eyes’ company infrastructure—which may be causing it to run slow. Mike, who’s sitting next to you and going through the log lines with Athena, suddenly notices a high volume of outbound requests coming from your machines to a single address. This isn’t expected behavior for your website. So Mike comes up with a theory—your machines could have been hacked, and someone could be trying to carry out a denial of service (DDoS) attack, using your machines to target other infrastructure.
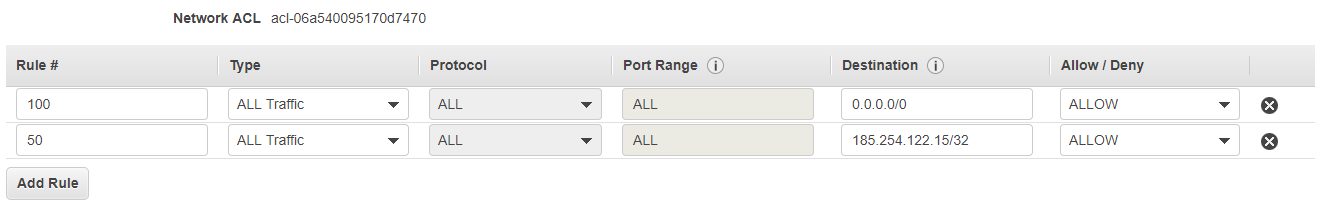
Now, you need to stop the attack while still allowing legitimate traffic through the website. The simplest way to block traffic in your VPC is to add a network access control list, also known as a NACL.
To do this, click on Network ACL in the Security section of the VPC service. You’ll see that a list already exists for your VPC. To add a rule, click on it, and in the Outbound Rules tab, click on Edit outbound rules, then Add rule.
Choose a number below 100 for your rule, select All Traffic, and add the IP you want to block.
In cyber security, active monitoring is essential. You should be capable of detecting and fixing anomalies, but you should also take preventive steps against attacks so you don’t run the risk of letting an attacker in. Next, you’ll learn how to prevent these attacks.
Ensure Compliance
Your company launched its TV channel this week and started publishing video content online. Unfortunately, for copyright reasons, you aren’t allowed to broadcast these on the island of Tuvalu (this is quite ironic, as Tuvalu has the domain name .tv). This means that you have to block all requests to your website from the island’s inhabitants.
Adding all of Tuvalu’s IP address ranges to your network access control list would be tedious work, but thankfully, Mike tells you about an AWS tool called AWS WAF.
AWS WAF uses three software features to filter traffic:
Web ACL: This is like a NACL, but for AWS WAFl. This is what blocks or allows traffic.
Rules: These are the rules for accessing your firewall. They group together conditions so that the web ACL can make a decision.
Conditions: These identify network packets. There are several types of conditions based on IP addresses or the appearance of packets.
You’re going to implement a geographical restriction for Tuvalu. To do this, go to the AWS WAF and Shield service, and click on AWS WAF. Click on Geo match and Create condition, then choose:
Name: the name of your Region.
Region: your Amazon Region.
Location type: choose country.
Location: choose Tuvalu - TV.
Click on Create. You’ve just created a condition, and now you need to create a rule to link to it. Click on Rules, then Create rule. Then choose:
Name: a name for your rule—it can be anything you want.
Cloudwatchmetric name: the name of the metric that corresponds to the rule.
Rule Type: choose does originate from a geographic location in, and select your condition.
Click on Create.
For the rule to be effective, you need to create a web ACL based on this rule. Click on Web ACL, then Create web ACL. Read the concepts, then click Next. Fill in the following information:
Web ACL name: a name of your choice.
CloudWatch metric name: a name of your choice.
Region: your AWS Region.
Resource type to associate with web ACL: choose Application Load Balancer.
AWS resource to associate: select your load balancer.
Click on Next.
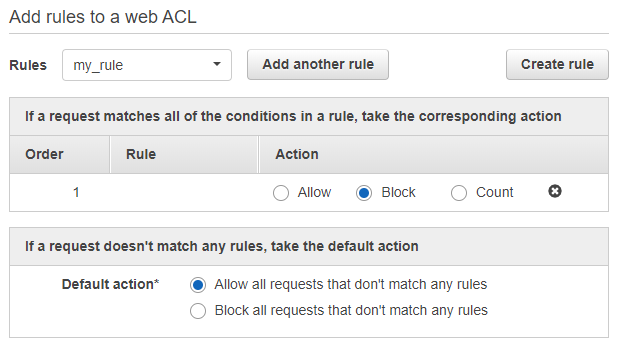
You can skip the screen for creating conditions, as you already have one. Click Next. In the section Add rules to a web ACL, select your rule, click on Add rule, and configure it like this:
In the actions table, select Block, as you want to block the traffic intercepted by this rule.
For default action, leave Allow, as you want to allow traffic that isn’t affected by the rule.
Then, click on Review and Create, Confirm, and then Create.
Let’s Recap!
You can log information from your network using VPC Flow Logs.
You can use Athena to analyze large quantities of data from VPC Flow Logs.
Analyzing network logs helps you identify threats within your infrastructure.
You can block specific IP addresses using a network access control list (NACL).
To create a geographical restriction, you can use an application firewall on your load balancer called AWS WAF.
AWS WAF can identify traffic coming from a certain country, and analyze the format of requests to identify anomalies or attacks, such as SQL injections.
Unwanted traffic is now blocked on your load balancer! However, you’ve had a telling-off from Mike for not spotting it sooner—you should have had system monitoring mechanisms in place. You’ll find out about these in the next chapter.
