Get Some Practice Performing Bivariate Analyses
It's Your Turn!
One of the most common data sets used in statistics courses and tutorials is called “Iris.” This data set consists of measurement samples taken from species of the Iris variety. For each flower (individual), four features (variables) were measured:
petal length
petal width
sepal length
sepal width
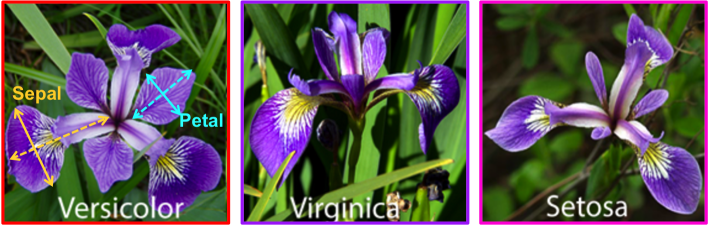
The fifth variable is the species, of which there are three: Setosa, Versicolor and Virginica.
The original data set has been modified; some values have been deleted, resulting in some missing attributes. Other values have been modified.
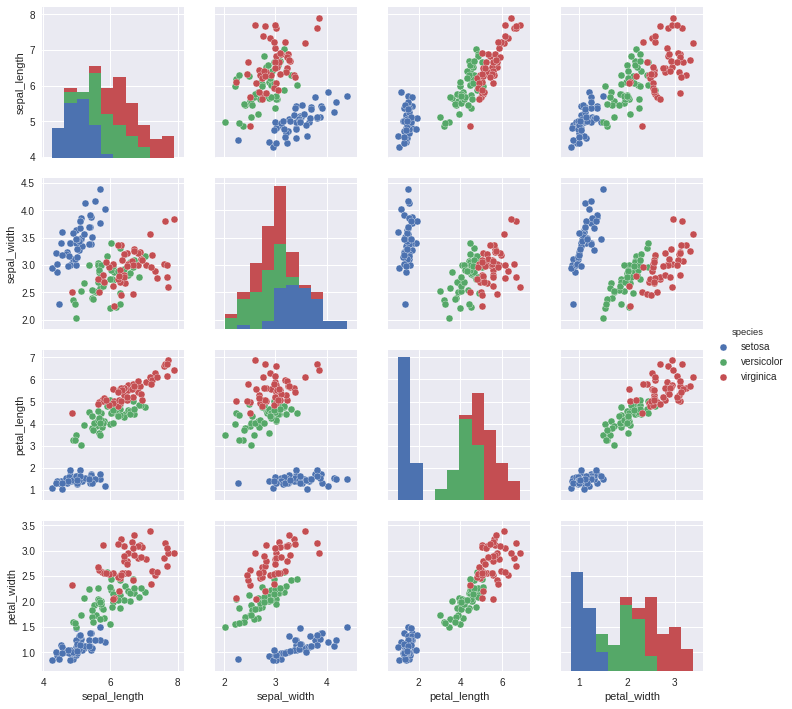
Here are scatter plots for the qualitative variables, analyzed in pairs. The points on these diagrams have been color-coded according to Species (a qualitative variable).
Here is the Python code for loading the data set:
import pandas as pd
import matplotlib.pyplot as plt
import seaborn as sns

# Download
iris = pd.read_csv("iris_dataset.csv")

# Rename the columns
iris.columns = ["id","sepal_length","sepal_width","petal_length","petal_width","species"]

# Delete the identifiers
del iris["id"]

# Delete individuals with at least one missing value
iris_dna = iris.dropna(axis=0, how='any')
print("iris : {} individuals, iris_dna : {} individuals".format(len(iris),len(iris_dna)))

# Show dispersion diagrams
sns.pairplot(iris_dna,hue="species")
plt.show()
iris_dna has been divided into three samples, one for each species:
iris_setosa = iris_dna[iris_dna["species"] == "setosa"]
iris_virginica = iris_dna[iris_dna["species"] == "virginica"]
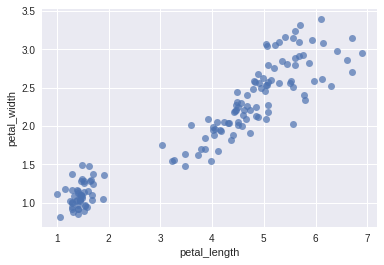
iris_versicolor = iris_dna[iris_dna["species"] == "versicolor"]Here are two scatter plots:
one showing petal_width as a function of petal_length
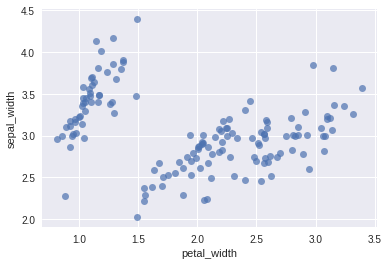
one showing sepal_width as a function of petal_width
Questions
Question 1:
In the iris_dna dataframe, calculate the following linear correlation coefficients:
petal_width as a function of petal_length
sepal_width as a function of petal_width
Question 2:
Explain the results of Question 1 using the two scatter plots provided above in the statement.
Now, bear in mind the linear correlation coefficient of sepal_width as a function of petal_width. It has been calculated for all of the irises. If the linear correlation coefficients are calculated for these same variables, but are separated by species, the following results are obtained:
sepal_width as a function of petal_width for iris_setosa: 0.753
sepal_width as a function of petal_width for iris_virginica: 0.685
sepal_width as a function of petal_width for iris_versicolor: 0.825
Compare (in your head) these three results to the result obtained for all of the irises above (Question 1).
Question 3:
You will calculate four linear regressions (using the Method of Ordinary Least Squares). We will use the following notation: Y = aX + b + epsilon .
a and b are the real numbers you need to estimate, epsilon is the term of error (you don’t need to worry about this), X and Y are two variables.
The four linear regressions correspond to each of these four cases:
Case 1: X is the variable petal_length, and Y is the variable petal_width, in the iris_dna dataframe
Case 2: X is the variable petal_width, and Y is the variable sepal_width, in the iris_setosa dataframe
Case 3: X is the variable petal_width, and Y is the variable sepal_width, in the iris_virginica dataframe
Case 4: X is the variable petal_width, and Y is the variable sepal_width, in the iris_versicolor dataframe
For each of these examples, estimate a and b.
Question 4:
Here are four rows, each of which contains missing data:
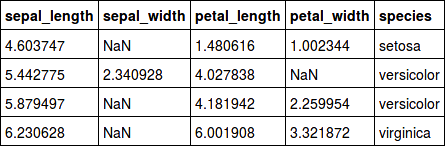
For each individual, the missing attribute is found either in the petal_width variable, or in the sepal_width variable. In both these cases, the values can be imputed (filled in) using the linear regressions we analyzed before. These values will approximate the actual values, but will be false.
Assuming that one individual never has more than one missing value, here is the code that uses linear regressions to replace the missing values. Parts of the code have been removed and replaced by “[...]”: it is up to you to fill them in.
coeffs = {
    "case 1" : {'a': [...] , 'b':[...]},
    "case 2" : {'a': [...] , 'b':[...]},
    "case 3" : {'a': [...] , 'b':[...]},
    "case 4" : {'a': [...] , 'b':[...]},
}
modified_lignes = []

for (i,individual) in iris.iterrows(): # for every individual of Iris,...
    if pd.isnull(individu["petal_width"]): #... we test if individual["petal_width"] is null.
        a = coeffs["case 1"]['a']
        b = coeffs["case 1"]['b']
        X = individual["petal_length"]
        Y = a*X + b
        iris.loc[i,"petal_width"] = Y # we replace the missing value by Y
        modified_lines.append(i)
        print("we filled petal_width with {} based on petal_length={}".format(Y,X))

    if pd.isnull(individual["sepal_width"]):
        espece = individual["species"]
        X = individual["petal_width"]
        [...]
        modified_lines.append(i)
        print("We filled sepal_width with {} based on the species:{} and petal_width={}".format(Y,species,X))

print(iris.loc[modified_lines])
Deliverables
the Python code you used to answer the questions in .py format. If you wish to submit your work in a notebook, please also submit a version in .py, in case your grader has not installed the program necessary for reading the notebook.
the answers to the four questions in .txt file format.
Check Your Work!
