Adopt the Basic Terminology Used in Statistics
Now that we have cleaned our data, we need to know how to represent it!
Before we dive in head first, I'm first going to provide an overview of statistics.
An Overview of Vocabulary
In statistics, we study thingamajigs, whatchamacallits, and other things.
Awesome. Thanks for telling me! Anything else?
Let me break it down for you! These “things” are known in statistics as individuals. Individuals can be objects, people, animals, physical measurements, etc. An individual is a unit of observation.
Individuals have characteristics: these are called characters, attributes, or variables.
The set of all of the individuals is called a population. Its size is often denoted by N , which corresponds to the number of individuals in the population. The exact size of a population is often unknown.
A subset of individuals within a population is called a sample. Its size is often denoted by n.
The term dataset will be used over and over again. This term has no exact definition, but for the purposes of this course it will be equivalent to a sample.
How is a sample represented?
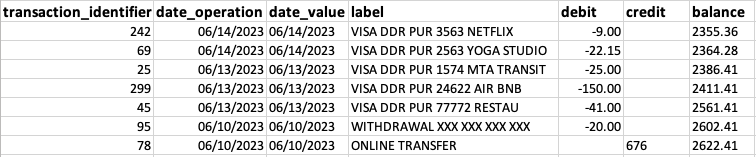
In general, a sample is represented in the form of a table, in which each row corresponds to an individual, and each column represents a variable. This representation forms the basis of the file format known as CSV (Comma-Separated Values). CSV files can be opened in a spreadsheet program (Microsoft® Excel, OpenOffice Calc), and are easily interpreted by R and Python.
An Overview of Statistics
Understand the Difference Between Statistics and Probability
Statistics and probability are the same thing, aren’t they?
Uh... no! The two fields are certainly closely related, but they are distinct from one another. When all you are doing is observing and describing objectively, that’s statistics.
But as soon as you start modeling, making connections between observation and theory, that’s probability: at that point, you’ve moved into the world of inferential statistics.
In statistics, the data you observe are called observations, or sometimes realizations. Based on these observations, you can form models. Statistical modeling is a way of determining the mathematical rules governing the data you observe. With probability, you work with random variables, laws of probability, etc.
For example, to study the proportion of men to women in a country, you select a sample in which you observe a proportion of 55% women to 45% men. These are statistics.
But if you then say, in this country, each child that is born has a 55% probability of being female, now you are working with probability!
The Different Branches of Statistics
Descriptive Statistics
Descriptive statistics is what this course is all about! It deals with the presentation, description, and summarization of data sets using graphs and measures (such as the mean, standard deviation, etc.). In descriptive statistics, each graph (or measure) is calculated on the basis of one or two variables at a time, no more. Why? Because it is fairly simple to represent the relationships between two variables on a graph, both on paper and on a screen, because you’re only working in two dimensions (length and width).
Exploratory Data Analysis
Exploratory data analysis is an extension of descriptive statistics, except that here, you study the relationships between three or more variables. Graphs with 3, 4, 5, or 100 dimensions can’t be represented on two-dimensional paper. We need special techniques to further describe and explore the data.
Inferential Statistics
Inferential statistics deals with analyzing data relating to a sub-population in order to infer the characteristics of the population as a whole. If one day you find yourself talking about estimators and hypothesis testing, you’ll be working with inferential statistics.
Statistical Modeling
Statistical modeling involves observing the characteristics of a sample, then formalizing these observations according to mathematical rules. This formalization is called a probabilistic model. When you describe a phenomenon using a model, you can make forecasts or predictions.
Take It Further: Data Analyst vs. Data Scientist
But what’s the difference between a Data Analyst and a Data Scientist?
The distinction between these two professions is somewhat hazy, but Data Analysts can be said to work with descriptive, exploratory, and inferential statistics. Data Scientists must master all three of these disciplines, but must also be capable of modeling phenomena. They have a battery of algorithms at their disposal that enable them to find the most effective model for the problem they are analyzing.
