Investigate customer behavior with Google Analytics
In the last chapter, we looked at how Google Analytics can be used to tell us about the acquisition of new customers. We saw how to identify which channels were responsible for new customers and how to identify which of those channels provided the highest conversion. We also looked at how to determine which individual sites referred traffic and which search terms were the most popular in search engines.
As well as understanding how visitors get to our site, we really need to understand what they actually do once they visit us. The behavior section of Google Analytics tells exactly that. Let's look at four reporting elements in Google Analytics which help us to understand visitor behavior:
Behavior Overview report
Site Content report
Landing Page report
Exit Pages report
1. Behavior Overview report
To access the Behavior Overview report, you can navigate to this area of the Google Analytics menu:
Then you will see a wide range of information, organized in graphs:
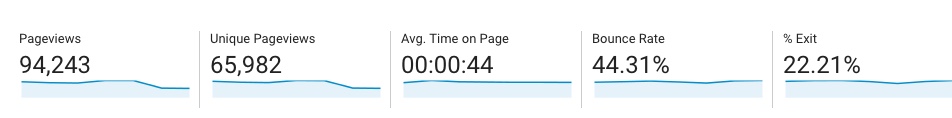
As you can see in the image above, the Behavior Overview report yields some insights, including:
Page views
Unique page views
Average time on page
Bounce rate
Exit rate
Let's examine each of these measurements in more depth:
Page views - A page view is an instance of a page being loaded in a browser. Every time a visitor goes to a new page on your site, this is counted as a page view. Note that if a visitor goes to a web page and clicks reload ten times, then this is regarded as ten page views. If a user navigates to a different page and then comes back to an original page, this is also counted as a page view.
Unique page views - A unique page view represents the number of sessions, or consecutive time spent on your site by a user, during which that page was viewed one or more times. This means that if a user visits the home page fifty times in a session, this counts as one unique page view.
Average time on page - This is the average amount of time that a visitor spends on this page. This doesn't mean that the visitor spent every second looking at their computer screen. If they leave the page open and go off to make a cup of tea, the entire time that this page was open in the browser is counted as time on the page.
Bounce rate - A bounce is an event where people visit your site, view only one page and then leave. These visitors did not stay on your site. Like a tennis ball hitting a wall, this person came to your site and bounced right out of it again. A 20% bounce rate means that one in five of your visitors only viewed a single page of your website.
Exit rate - The exit rate measures how often people exit your entire site from a given page. A web page experiences an "exit" when it is the last page a visitor sees before they leave your site.
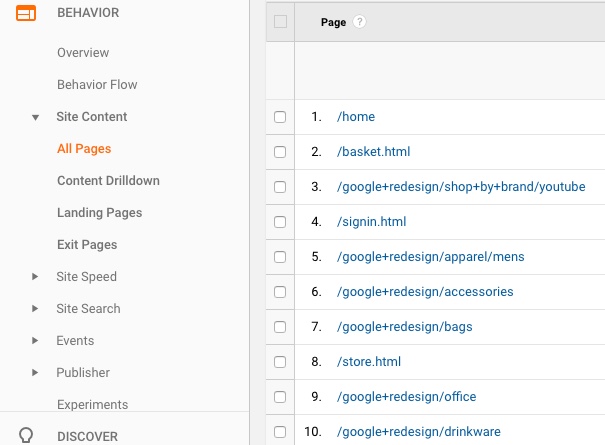
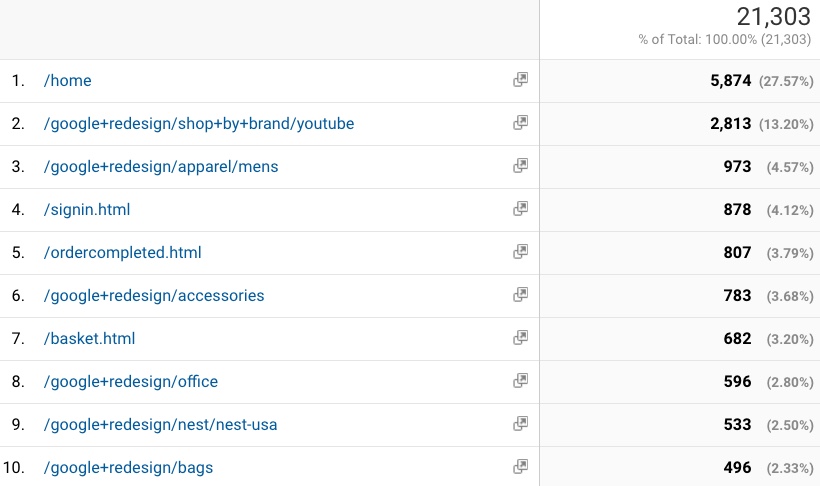
2. Site Content report
The Site Content report shows the same information categories as Behavior Overview report, but allows you to see it on an individual-page level.
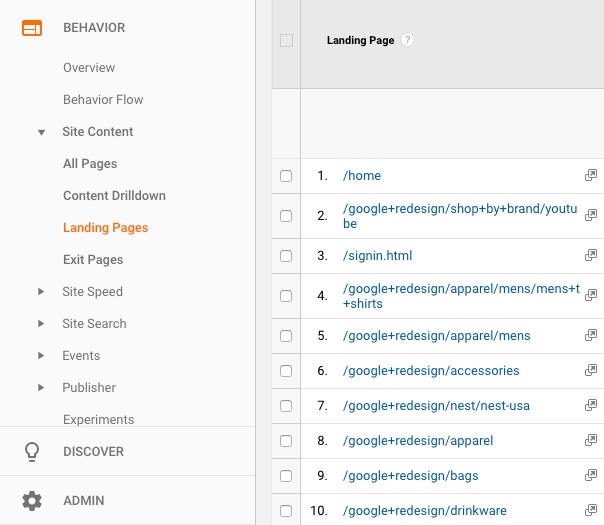
3. Landing Pages report
Unbounce is a software for creating landing pages. They define a landing page as:
a standalone web page, created specifically for the purposes of a marketing or advertising campaign.
Typically, a landing page is a single page used to:
Describe your product or service.
Illustrate some advantages of using your product or service (your "unique value proposition").
Display a button that lets interested visitors click to read more, join a mailing list, buy now, or some other action.
The Landing Pages report will display which landing pages are getting the most traffic and resulting revenue. You can see the list of landing pages and then click on that page to see more.
For any given landing page, you can view:
Number of sessions where this landing page was visited
Number of new users visiting this page
Bounce rate
Pages/Session
Average session duration
Number of transactions
Revenue
If you saw that the session duration was long or that a large number of pages were viewed when people entered your site from a given landing page, then you can assume that the content of this page is well-received by those people. In other words, this landing page is working well. You may want to increase the traffic coming to this landing page by using more online ads. In particular, if you know how much revenue typically results from people who enter your site from a given landing page, then you know how profitable it is when you successfully get traffic to this page.
4. Exit Pages report
As we've seen before, a web page experiences an exit when it is the last page a visitor sees before they leave your site. You can see a list of the pages that were most frequently "exited" - meaning the percentage of the time this page was the last page a visitor saw before leaving the site.
Knowing which pages are the last pages viewed by a visitor is actionable information because you can:
Check that this page is working as expected (i.e., check people are not exiting because of a problem like long page load time).
Think about what information you would like people to have before they leave the site. Should they be given a phone number to call in case of emergencies? Should you suggest a more suitable moment to visit your site again?
Give users an immediate incentive to stay on site.
As well as viewing visitor behavior such as pages viewed, time spent and bounce and exit rates, you also want to see when visitors take actions you care about such as buying products, joining a mailing list, or downloading white papers.
We will look at how to set goals to track when visitors take actions that help achieve your business goals in the next chapter on conversions!
Summary
The behavior section of Google Analytics tells you what visitors are actually doing on your site.
In particular, you can see:
Aggregate-level page views, time spend per page, bounce rate and exit rate in the Behavior Overview report.
Page-level page views, time spend per page, bounce rate and exit rate in the Site Content report.
The highest-performing landing pages in the Landing Page report.
The last page visitors see before they leave the site in the Exit Pages report.
Additional resources
13 ways to reduce bounce rate.
Examples showing the difference between bounce rate and exit rate.
Another excellent article on bounce and exit rates.
