Take Advantage of Being Data Literate
Consider the Impact of Data on Individuals
In the video we met Leonardo, a delivery driver working for a small organic food supplier, GardenFresh Organics. Each day, GardenFresh assigns their three drivers a number of deliveries, which they need to pick up from the central food depot and deliver by van to local customers. The drivers choose which deliveries they want to carry out and get paid $20 for each delivery made, plus $0.50 for each mile driven.
GardenFresh needs to process a lot of data to assess how well their business is doing and make clear decisions (like how much to pay drivers). To simplify this, they will measure progress using a set of key performance indicators (KPIs).
One such KPI will be how many minutes early or late each driver is on average. Another is each driver’s star rating (based on customer feedback).The driver’s payment is calculated based on a daily performance review.
For example, here is one of Leonardo’s daily schedules:
KPI Calculations
Customer | Distance (miles) | Scheduled Time | Actual Time | Minutes off schedule | Customer Rating |
Leave Depot | 0 | 10:00 AM | 10:00 AM |
|
|
Mrs. P | 15 | 10:40 AM | 10:45 AM | 5 | ***** (excellent) |
Mr. A | 25 | 11:40 AM | 11:50 AM | 10 |
|
Ms. M | 20 | 12:30 PM | 12:35 PM | 5 |
|
Mr. B | 18 | 1:16 PM | 1:21 PM | 5 | **** |
Mrs. T | 12 | 1:50 PM | 2:00 PM | 10 | *** (dropped my eggs!) |
Deliveries: 5 | Distance: 90 miles |
|
| Schedule KPI Average: 7 | Ratings KPI Average: 4 |
At the bottom of the table, you can see the two KPI calculations: total miles and number of deliveries. These can be used to calculate Leonardo’s pay for the day:
Total Pay |
Deliveries: 5 x $20 per delivery = $100 Distance: 90 miles x $0.05 per mile = $45 Schedule bonus (max $15, -$1 per minute late): 15 - 7 = $8 Rating bonus ($3 per star KPI): 4 x 3 = $12 |
Total: $165 |
GardenFresh feels that this system will allow the company to grow and track its performance. In addition, the customers are happy because they know when their food will be delivered and can expect fresher produce. Leonardo is happy with the new system but has a few concerns. He summarizes these in a table:
Data | Benefits for Leonardo | Leonardo's Concerns |
Schedule map | It simplifies his role, as he no longer has to schedule his daily deliveries himself. With the old system, he sometimes over-committed and had to deliver late into the evening. | What happens if the pressure to meet more challenging delivery targets increases as GardenFresh grows? |
Schedule KPI | He knows he’s a good and conscientious driver, and is pleased that he can qualify for performance bonuses. | Will he still be able to enjoy his little daily detours? |
Ratings KPI | He’s always friendly and helpful, and feels that the customers will give him good reviews. | Mr. Z on Cotton Lane is grumpy and likes to complain, which might affect his rating. Additionally, his tight schedule may limit his ability to help customers unpack their groceries, affecting his ratings. |
Could being more data-savvy help Leonardo benefit from these KPIs? Could he use them to raise his concerns with GardenFresh management?
Absolutely! He could:
better understand what affects his paycheck and adapt his schedule and routes to his benefit.
show management that having a schedule with more buffer would allow him to spend more time with customers, leading to higher customer satisfaction and more orders.
show management that having an adequate lunch break leads to fewer issues and better customer ratings for afternoon deliveries.
We haven't seen the last of Leonardo and GardenFresh. We'll revisit them in videos later on in this course!
Recognize the Role of Data Literacy for Building a Critical Worldview
Since you started this course, you probably already understand the importance of familiarizing yourself with the world of data. And it isn’t just essential in your data-heavy workplace! It can also help in your everyday life, allowing you to interact more effectively with the world.
So what exactly does it mean to be data literate?
Breaking this down, you can clearly see the skills of a data-literate person. They are able to:
read, work with, and analyze data.
derive meaningful information from data.
understand what data means.
read charts appropriately.
draw correct conclusions from data.
make arguments with data.
recognize when data is being used in misleading or inappropriate ways.
So, what can I do with these data literacy skills?
Make better-informed decisions. You constantly make decisions in your life. Some are trivial (“Should I have mushroom or pepperoni on my pizza?”). Some are important (“Which university should I attend?”). Sometimes it’s OK to decide based on gut instinct (“I’ll have pepperoni and mushroom!”). But for the more important decisions, considering the data can help you make better decisions. For example, it’s a good idea to consider the university’s location, reputation, social life, and other factors before deciding.
Challenge statements made by others. People often say, “The data shows …” or, “Statistics tell us …”. They are trying to convey the message: “I’m telling you the facts!” But data presented in this way is often not factual. Having the skill set to examine the data yourself and challenge these facts is a significant advantage.
Communicate your thoughts more effectively with others. When you feel passionate about something, you want to persuade others to share your passion. Presenting evidence through carefully selected data or pretty data visualizations can have a big impact!
Identify the Jobs in Data
If I decide to work with data, are there any job opportunities for me?
Yes, plenty! As the amount of data in the world grows, so do data-specific jobs.
Here are just a few data roles you might encounter in organizations. As you can see, they can be mapped along the transition from data to action that we talked about previously:
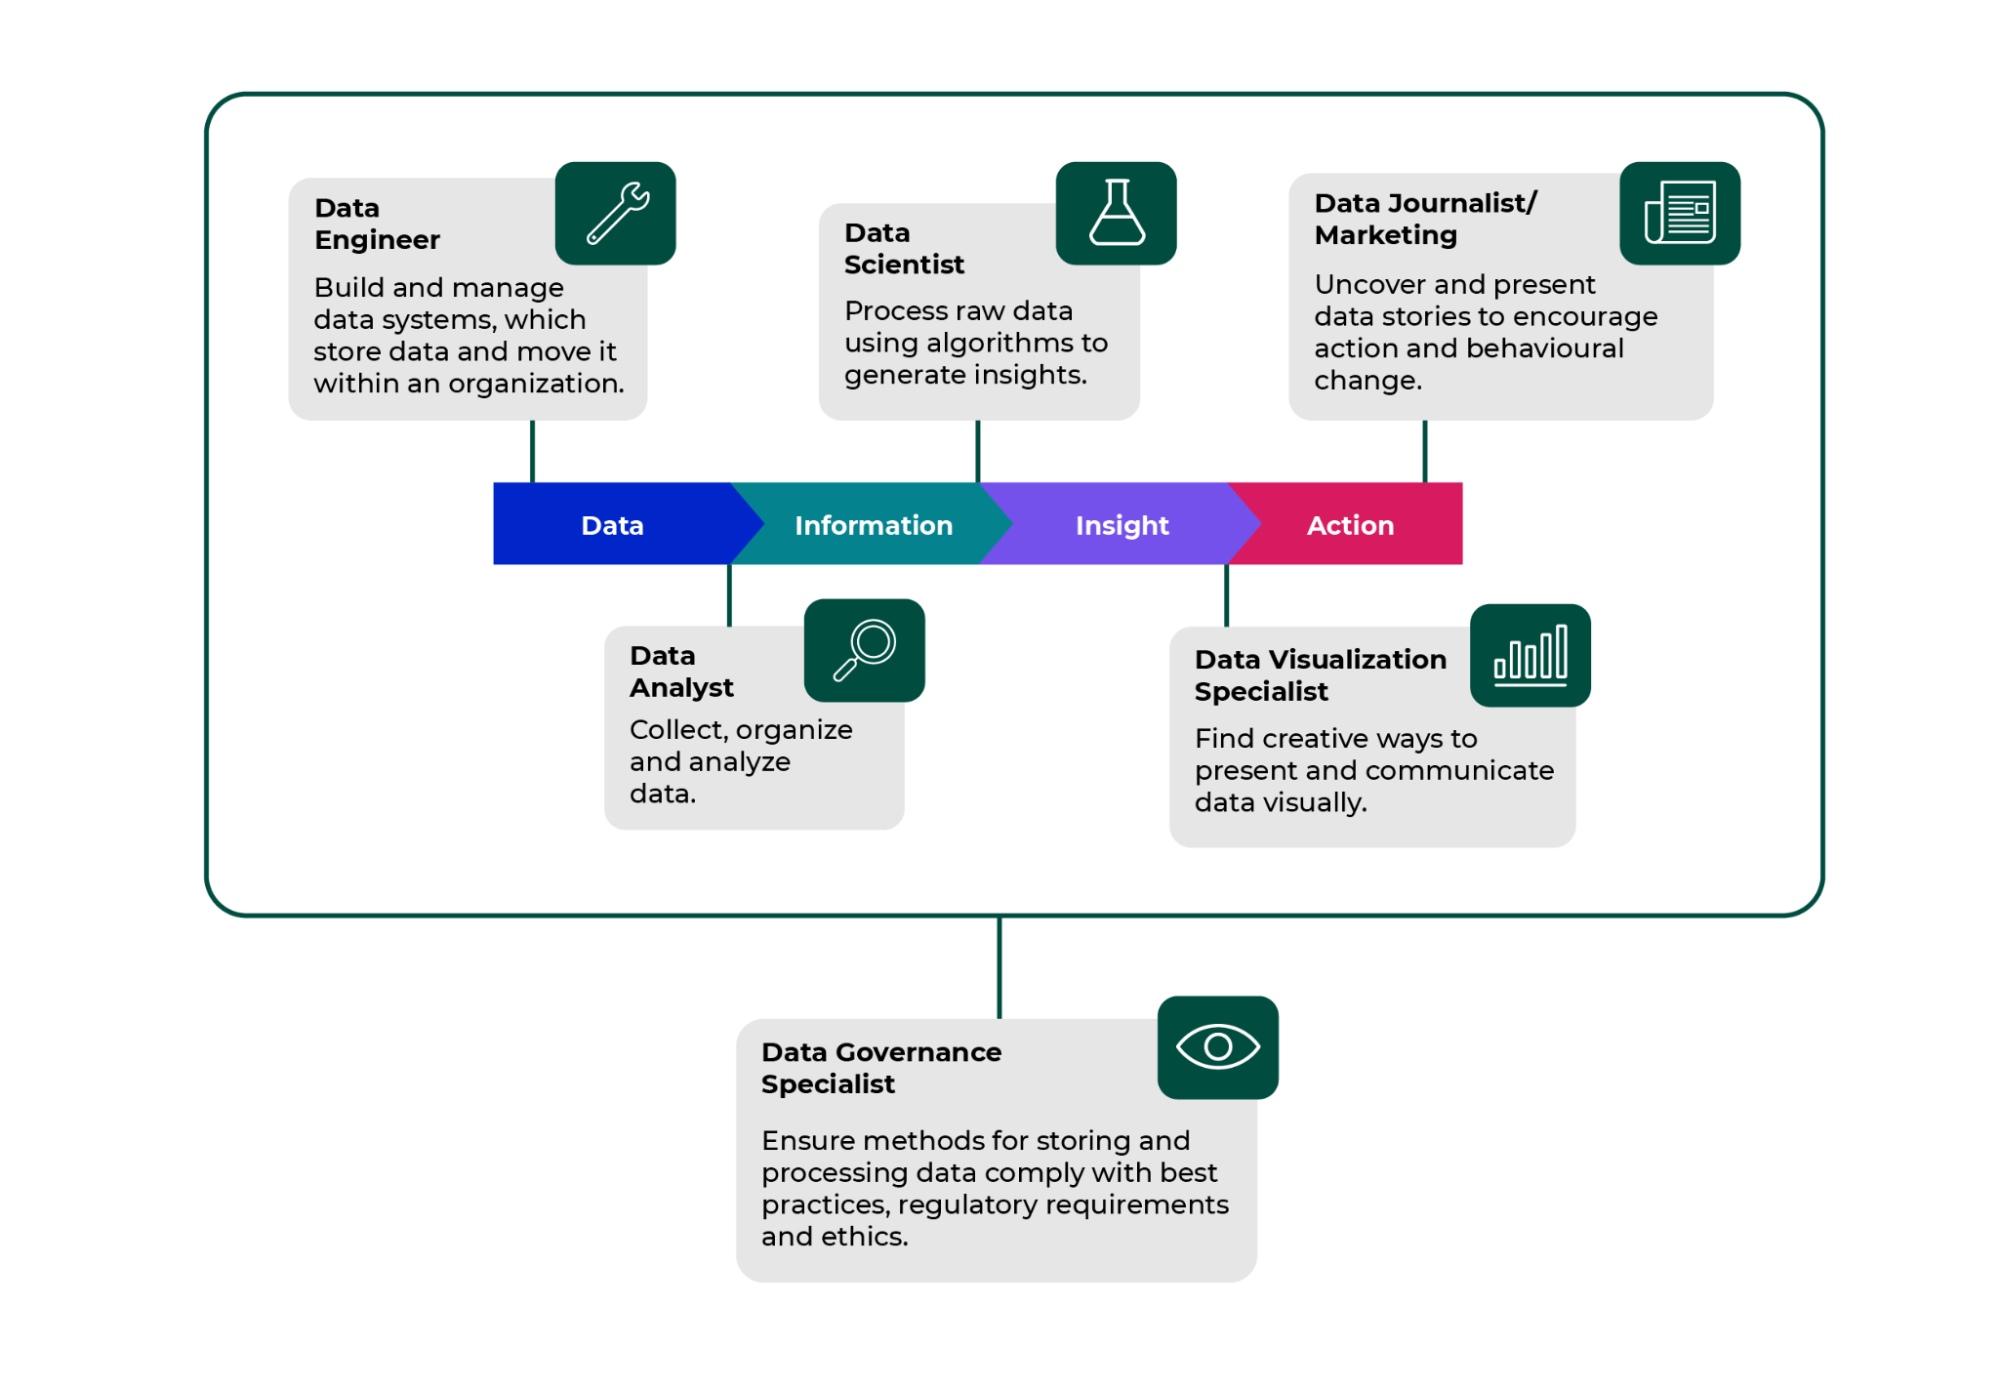 Over the rest of this course, you will get a small glimpse of what it's like to be in these roles. Being data literate requires you to wear many hats! You need to build a skill set, which can develop into a career path of its own in a large organization.
Let’s Recap!
Organizations becoming more data-driven will have an impact on everyone.
Being data literate can help you make better-informed decisions, challenge statements made by others, and communicate more effectively.
There are many opportunities to build a career in data or augment how you use data in your work.
Hopefully, you're now convinced that you want to become a data-savvy individual. So let’s start working towards it! We will begin by exploring the data pipeline model in the next chapter.
