Enable additional Actuator endpoints
In the previous chapter, you saw how to use and enhance /info and /health endpoints. They are useful to get an overview of the state of a running application, but that's not all we need to know. We need some insight into the internals of a running application to monitor its performance or possibly investigate some unusual behavior. Spring Boot Actuator comes with a few more endpoints that can provide us with such information.
So, let's see how we can expose some of the more commonly used ones.
Expose/beans
This is an interesting endpoint because it gives you insight into Spring context internals. It could come useful in some troubleshooting scenarios because you can double-check if the Spring beans are configured the way you expect them to be. For example, you might have a conditional bean configuration, as we did, and you might want to check if the right implementation has been picked as a dependency. 🔍This is a great way to do that.
Simply add beans to the list of exposed management endpoints:
management.endpoints.web.exposure.include=info,health,beansExplore the response JSON file and try to locate the beans we have created so far.
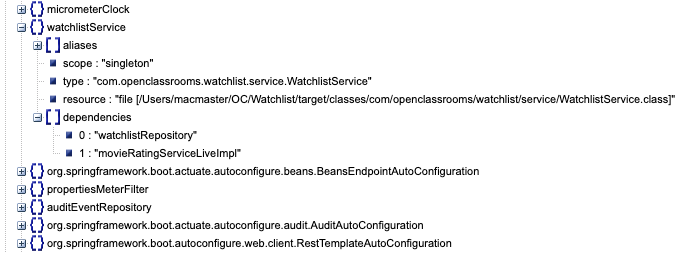
Now go to http://localhost/actuator/beans and explore the JSON response. See if you can find all the beans we manually created.
Expose /env
So far, we’ve been configuring the settings or properties of our application through the application.properties file. But that’s only one source of properties for a Spring application. Properties could also come from different sources like OS environment variables, JVM system properties, command line arguments, and so on.
This endpoint gives visibility to the values made available through all these sources. It could be a very useful tool to make sure that an instance of the application is started with the correct configurations.
Simply add beans to the list of exposed management endpoints:
management.endpoints.web.exposure.include=info,health,beans,env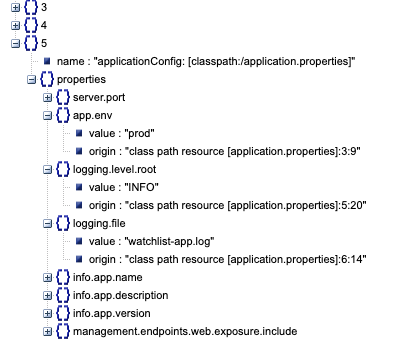
Now go to http://localhost/actuator/env and explore the JSON response. See what pieces of information other than application.properties look familiar to you.
Expose/metrics
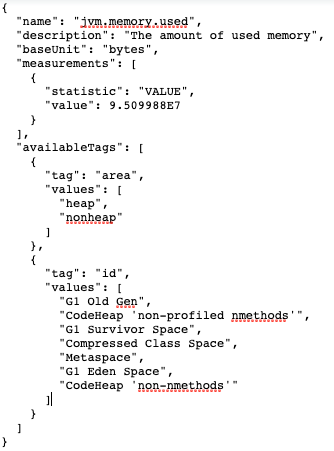
One of the factors that could affect the performance of an application is the lack of resources like memory and CPU bandwidth. Sysadmins and DevOps engineers would like to be preemptive about these issues and do something about them before they affect the users' experience. The/metrics endpoint gives you some good information at the JVM and OS (Operating System) level about allocated and used resources. This endpoint is a bit different in the way it exposes data. It's a navigable endpoint that first shows you the available variables, then allows you to use those variables to navigate through the available data. Let's see how it works.
Simply add beans to the list of exposed management endpoints:
management.endpoints.web.exposure.include=info,health,beans,env,metrics If you go to http://localhost/actuator/metrics in your browser, you see a bunch variables with no actual values. You can use those variable names to navigate through data. For example, you can check out how much memory in JVM is used by going to http://localhost/actuator/metrics/jvm.memory.used.
Expose /httptrace
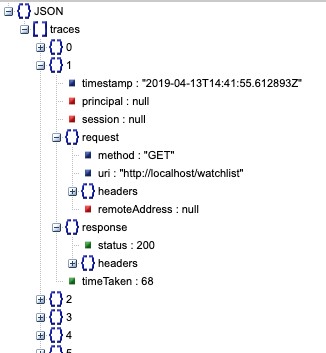
HTTP requests and responses are at the front and center of any web application. You might be interested in some statistics about the requests coming to your application; e.g., how many of them were successful, how many of them came with a specific header value, how long they took to complete, etc. One way could be logging every single request that arrives and then analyzing that data.
That's...so many logs! 😵 Isn't there another way?
Yes, don't worry! While that approach is possible, /httptrace provides a more lightweight solution by giving you a sample data of the last 100 HTTP requests and responses. Let’s see what it looks like!
Simply add beans to the list of exposed management endpoints:
management.endpoints.web.exposure.include=info,health,beans,env,metrics,httptrace Now go to http://localhost/actuator/httptrace and explore the JSON response.
Let's recap!
In this chapter, you saw how to use some new endpoints:
Expose the
/beansactuator endpoint to check bean configuration.Expose the
/envactuator endpoint to see environment variables and properties, which is useful for troubleshooting.Expose the
/metricsactuator endpoint to get information about the state of your application's OS and JVM.Expose the
/httptraceactuator endpoint to get some basic information about the last 100 HTTP requests and responses.
Alright, now that you know what endpoints exist, let's check out how to create some custom actuator endpoints! 😁
